Download
1 / 42
430 likes | 644 Vues
VUV (photoemission) spectroscopy K.C. Prince, Sincrotrone Trieste, Trieste, Italy. Gas phase. 1. Doubly excited states of helium. 2. Biomolecules. 3. Dichroism 4. Two colours Surfaces and solids. 1. Classical application: band mapping

E N D
VUV (photoemission) spectroscopy K.C. Prince, Sincrotrone Trieste, Trieste, Italy Gas phase. 1. Doubly excited states of helium. 2. Biomolecules. 3. Dichroism 4. Two colours Surfaces and solids. 1. Classical application: band mapping 2. Resonant photoemission from thin film catalysts, CeO2/Cu 3. Adenine/Cu(110) The future: the Fermi free electron laser light source.
Experimental Our beamline Gas Phase photoemission beamline, Elettra. VG 220i electron energy analyser. Our undulator
Doubly excited states of helium are two electron states in which neither electron is in a 1s orbital: Naively – nln’l’ n, n’>1 Lowest energy series: 2snl, 2pnl, i.e. the states below the second IP, N=2. For Helium, they are in the energy range 60-80 eV. • Why study them? • - The simplest three body problem in atomic physics, • - the simplest system where correlation is important, • a benchmark system, etc.
The doubly excited states of helium: a brief history Doubly excited states were sought (and one state found [1,2]) as early as 1930. After this, there was a pause. Madden and Codling in the early ’60s then used synchrotron radiation to measure two of the 3 predicted series [2]. Fano and Cooper provided the theory, and there was another pause (for experimentalists) while theoreticians thought hard. 1990s: third generation synchrotron light sources threw some light on the matter. Domke et al: observed all three 1Po series below N=2, plus many more below higher N. [1] P. G. Kruger, Phys. Rev. 36, 855 (1930). [2] R. P. Madden and K. Codling, Phys. Rev. Lett. 10, 516 (1963); Astrophys. J. 141, 364 (1965). [3] M. Domke et al, Phys. Rev. A 52, 1424 (1996).
The doubly excited states of helium: recent history • Recent results: • partial VUV fluorescence yield spectra gives a different view of the doubly • excited states compared with ion yield [4, 5] • the ion yield does not give the true cross-section for these states [5, 6] • spin-orbit coupling is important, even for He [7] • with photons, you can excite not only 1P states, but also triplets 3P, 3D [8] • He offers a window on “quantum chaology” [9] • - Lifetime measurements of the fluorescence tell us about correlation [10] • - Stark effects are also interesting (more later) [11, 12] [4] M. K. Odling-Smee et al, Phys. Rev. Lett. 84, 2598 (2000). [5] Jan-Erik Rubensson et al, Phys. Rev. Lett. 83, 947 (1999). [6] K.C. Prince et al, Phys. Rev. A. 68, 044701 (2003). [7] Thomas Ward Gorczyca et al, Phys. Rev. Lett. 85, 1202 (2000). [8] F. Penent et al, Phys. Rev. Lett. 86, 2758 (2001). [9] R. Püttner et al, Phys. Rev. Lett. 86, 3747 (2001). [10] J. Lambourne et al, Phys. Rev. Lett. 90, 153004 (2003) [11] J. R. Harries et al, Phys. Rev. Lett. 90, 133002 (2003). [12] X.M. Tong and C. D. Lin, Phys. Rev. Lett. 92, 223003 (2004)
The difference between VUV fluorescence and ion yield. Ion yield (upper curve, left scale) and fluorescent UV photon yield (lower curve, right scale) at the (2,-13), (2,14) resonances. The long lived state decays by fluorescence, while the shorter lived state decays by autoionization (ion yield). So that state is stronger in partial fluorescence yield.
Some recent work: the Stark effect for doubly excited states. The Stark effect: the response of a quantum system to an external electric field – energy shifts and splitting of magnetic sub-levels. An early triumph of quantum mechanics. Fields up to 84 kV/cm; new propensity rule.
3 ways of looking at the Stark effect + - Classical electrostatics: charge moves from one side of atom to other; gives an approximate value of Stark shift. + Mixing of atomic orbitals picture: explains asymmetric charge distribution. - + = + Stark operator mixes states of opposite parity. Nearby states of even parity are mixed. Photoabsorption sees only 1Po states; there are “dark” S, Pe, D, F, etc. states. (Triplet states allowed by spin-orbit coupling, recently observed.)
Experimental + Purpose built apparatus: parallel plate condenser, gap 5 mm. Cost approx. 50 cents.
Total VUV photon yield. Electric field F || P, photon polarization. (2,-1n) and (2,1n) states lose intensity. (2,0n) states gain intensity (maybe an artefact) a broad shoulder develops at higher energy for higher n. Fields are very low!
Static field F perpendicular to polarization P Quantum defect (1) =-0.435±0.005. Matches 1Pe series. A new series is observed, labelled 1. Another new broad series labelled 2 is observed (as in other geometry.) Big increases in intensity at high n.
How do we explain all this? First, there are selection rules. Parallel geometry, ΔM=0 perpendicular geometry, ΔM=±1. M= zero for ground and S states, so in the perpendicular geometry there is no mixing of S states. Then, theory confirms the series “1” is 1Pe. The broad features “2” are due to a pair of 1De states. In the parallel geometry, mixing occurs with 1Se states.
Quantitative modelling of energies, 5 kV/cm, F perpendicular to P. First order perturbation theory – A. Mihelič and M. Žitnik, Ljubljana.
Conclusions VUV spectroscopy is a powerful method for investigating the fluorescence decay dynamics of He doubly excited states. The wave functions in the excited state can be probed in detail and agreement with experiment is satisfactory. Stark effects on these states can be seen at moderate fields (< 1 kV/cm). A new series of the He doubly excited states observed, the 1Pe series. Indications of other series observed, 1Se and 1De. V. Feyer, M. Coreno, CNR-IMIP, Montelibretti (Rome), Italy, and INSTM, Trieste, Italy, R. Richter, Sincrotrone Trieste, Trieste, Italy, M. de Simone, A. Kivimäki, INFM-TASC,Trieste, Italy,and INSTM, Trieste, Italy, A. Mihelič and M. Žitnik, J. Stefan Institute, 1000 Ljubljana, Slovenia K.C. Prince et al, Phys. Rev. Lett. 96(2006) 093001.
Biomolecules: interaction with UV radiation Interest: damage by ionizing radiation astrobiology: synthesis and destruction of pre-biotic molecules in space (particularly Lyman α and He I) conformation and dynamics of this class of molecules mass spectrometry There exists a large body of electron impact ionization: why use UV radiation? Because it is more specific – dipole selection rules apply.
Photofragmentation with laboratory sources of UV glycine proline Aliphatic amino acids and Pro show strong fragmentation, even close to threshold. Mostly loss of HCOO. (Our work and Lago et al, Chem. Phys. 307(2004) 9). leucine
Methionine is different: • - loss of COOH is not the main channel • at low energies, the parent ion is the dominant peak • Why? O. Plekan et al, Chem. Phys. 334 (2007) 53–63.
UV photoionization removes an electron from a valence orbital. The Highest Occupied Molecular Orbital of aliphatic amino acids has nitrogen lone pair character. The HOMO of methionine has S lone pair character. The S atom accommodates the charge without fragmenting.
Amino acids with aromatic groups. Phenylalanine Tryptophan Tyrosine Tryptophan mass spectrum For all three amino acids, there is a significant parent ion signal at low photon energy. Fragmentation pattern differs: aromatic ring breaks off from rest of molecule. HOMOs have π character.
Next step – coincidences. E.g. Methanol, CD3OH. For amino acids we measured all ions produced by ionization of several orbitals. If we measure ions and photoelectrons in coincidence, we observe the fragments due to the ionization of a specific orbital. Work done at Spring-8, in collaboration with R. Richter, K. Ueda, G. Pruemper.
What is the conformational (folding) structure of a free bio molecule? Dilute species, biomolecules Circular dichroism (CD) in the near UV is a standard tool for secondary structure determination/control of large molecules. [I(left)-I(right)]/I~0.001-0.0001. + Sample in solvent, structure is “true” structure. - Sample in solvent, wavelength range limited to 180-250 nm circa. - low info content (few peaks). “Conventional” CD is best for: monitoring conformational changes due to a perturbation, quality control etc. Less good for absolute structure. Being extended to 120 nm (Daresbury-> Australian synchrotron, Brookhaven etc.) CD spectrum and secondary structure of proteins.
Dichroism Recently natural CD of small chiral molecules investigated. Optimal conditions: CD signal=[I(left)-I(right)]/I~0.04. Can we use VUV spectroscopy (and later Fermi) to obtain structural (folding) information? Higher energy -> no windows -> molecules in vacuum. Free molecules -> range extended above the IP -> potentially larger info content S. Turchini, N. Zema, G. Contini, G. Alberti, M. Alagia, S. Stranges, G. Fronzoni, M. Stener, P. Decleva, and T. Prosperi, Phys. Rev. A 70, 014502 (2004)
Proline, valence band spectrum Dichroism from 0 to 4%.
Valence band photoemission. He I. The two highest MOs are due to two pairs of conformers. By measuring spectra as a function of temperature, can extract free energy difference, 6-9 kJ/mol.
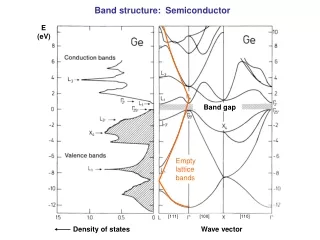
Surfaces and solids Photoemission from O/Ag(110). One of the most important applications of VUV photoemission spectroscopy has been band mapping. It will continue to be a standard method.
What science will be done? The valence band: gaps in high Tc superconductors, transport properties, bonding, etc. Oxides and related materials have large unit cells -> high momentum resolution required -> high angular resolution at low electron energy. Z.-X. Shen and co-workers are prolific users of low energy photons and Angle Resolved UPS. Huge output of results on oxide materials. ARUPS-> direct access to valence band structure. K.M. Shen et al, PRL
Microscopy: Pb/Au/Si(111) SPELEEM photoemission microscope, (now closed, upgraded to Nanospectroscopy). Sample: Au/Si(111) + 5 ML Pb. The Au induces layer by layer growth. Area: about 1 micron diameter. Time: one photon energy, one kinetic energy, all angles: about 60 s. One photon energy, all valence kinetic energies, all angles: tens of min. Valence band.
Inverse model catalyst: CeO2/Cu Many catalysts consist of metal particles supported on oxides. Oxide maintains dispersion, is a reservoir for oxygen, participant in SMSI (strong metal support interaction), catalyst, etc. Difficult to prepare single crystal oxides, easy to prepare metal crystals. ->Prepare oxides on metals. HR-TEM image of (a) Cu loaded ceria powder (b) elemental mapping of the area; white - cerium, red – copper. F. Šutara, V. Matolín et al, Thin solid Films, in press.
We can grow defect-free, well-ordered epitaxial CeO2 layers on Cu(111) LEED of CeO2/Cu(111), E = 98 eV, (a) discontinuous, (b) 2.5 ML, (c) 5 ML. Arrows mark substrate spots. Can we check for point defects (oxygen vacancies) with resonant photoemission?
Resonant photoemission Configurations CeO2, Ce4+, (4d105p6) 4f0, resonates at hv=124.5 eV Ce2O3, Ce3+, (4d105p6) 4f1, resonates at hv=122 eV Ce metal, (4d105p6) 4f15d16s2, resonates at hv=122 eV Resonant process: Ce 4d104fn 4d94fn+1 4d10fn interferes with direct valence photoemission. Resonant spectra show primarily Ce4+. Conclusion: film is epitaxial (LEED) and has low point defect density. F. Šutara et al, Thin Solid Films, 516 (2008) 6120.
DNA bases II: adsorption of adenine, C5H5N5, on Cu(110) A DNA base on a metal surface: a prototypical bio/metal interface. Has been studied by STM, vibrational spectroscopy, theory. Adenine, C5N5H5 Q. Chen and N. V. Richardson, Nature Mat. 2 (2003) 324 Q. Chen, D. J. Frankel, and N. V. Richardson, Langmuir 18 (2002) 3219 D. J. Frankel, Q. Chen and N.V. Richardson, J. Chem. Phys. 124, 204704 (2006).
Experimental conclusions from the literature: the molecule is lying flat (Yamada et al) the molecule is tilted slightly (Chen et al) or the molecule is strongly tilted (McNutt et al) Theory agrees: bonding through amino group. Molecule tilted up from surface, 18-26º. Vibrational studies: Q. Chen, D. J. Frankel, and N. V. Richardson, Langmuir 18 (2002) 3219 A. McNutt et al, Surf. Sci, 531 (2003) 131. T. Yamada et al, Surf. Sci. 561 (2004) 233–247. Q. Chen, D. J. Frankel, and N. V. Richardson, Langmuir 18 (2002) 3219 Preuss et al, PRL 94, 236102 (2005)
N 1s photoemission 0.6 ML > 1 ML Ordering Desorb excess Deposited Gas phase Bonding is very different at high and low coverage. N is involved in bonding. In particular, the two amino N atoms have unsaturated (imino) At low coverage: N 1s (398.7 eV) characteristic of π bonded N.
NEXAFS of adenine: Near Edge X-ray Absorption Fine Structure Spectroscopy 1 ML, annealed 430 K 0.3 ML, annealed 430 K Fractional monolayer: molecule lying almost parallel to the surface. Saturated monolayer: molecule(s) tilted
Collaborators. Oksana The Gas Phase team at Elettra O. Plekan, V. Feyer, R. Richter, M. Coreno, M. de Simone, Materials Science (Czech) Beamline T. Skala, V. Chab, F. Sutara, V. Matolin Tomas Vitaliy Robert Marcello Monica
Free Electron Lasers. Fermi specs. A seeded free electron laser: -> a conventional laser bunches the electrons -> the bunches pass through an undulator -> the electrons in each bunch emit coherently -> intensity is proportional to square of number of electrons, and square of number of periods in undulator. Fermi FEL 1: 12-30 eV; FEL 2: 30-126 eV. Pulses of 50 fs-1 ps 50 Hz GW power levels, 1014 photons/pulse Start operation at the beginning of 2009
If you can control the timing of light, you can learn new things… Eardweard Muybridge, 1878: do all 4 horse’s hooves leave the ground at once? A bet by Leland Stanford, wealthy ex-governor of California: early research at Palo Alto. Sub-second resolution. Harold E. Edgerton, 1964. Microsecond strobe. Or applied research, H. E. Edgerton, 1934.
Two photon double ionization Physics is different for two photon (hn>39.5 eV) and many photon (hn~ few eV) double ionization. ->control of relative field strengths.
FEL light is so intense that it ionizes all molecules in its path -> ultradilute samples. Clusters and “flying proteins”. Nanospray set-up for spectroscopy, with “unfree” lasers, T.R. Rizzo et al, PPCM, EPFL. Our schematic setup.
Setting up with Synchrotron Radiation: two photon spectroscopy of neon Synchrotron light: 30-65 ps bunch length, 2 ns interval. Neon atoms excited with synchrotron light. Then excited by a laser in a second step to resonant ionizing states. Two photon transitions: Δl=0,2. Proof of principle of lifetime measurements on nanosecond time scale. A. Moise et al, Nucl. Instrum. Methods A 588 (2008) 502.
P ~ Ne2 FERMI@Elettra FEL 1010 Increase ELETTRA Storage Ring FEL P ~ Ne Brightness ELETTRA