Download

1 / 40
400 likes | 641 Vues
FANCCO 2015 Uncertainty Handling Using Neural Network-Based Prediction Intervals A/Prof Dipti Srinivasan Department of Electrical & Computer Engineering National University of Singapore. Outline. Introduction – Uncertainty modeling methods

E N D
FANCCO 2015 Uncertainty Handling Using Neural Network-Based Prediction Intervals A/Prof Dipti Srinivasan Department of Electrical & Computer Engineering National University of Singapore
Outline • Introduction – Uncertainty modeling methods • NN-based PIs for Forecast Uncertainty Modeling • Advantages of PIs compared with point forecasting • LUBE Method for Constructing NN-based Prediction Intervals • Case Studies: • Testing on data sets • Uncertainty Handling in Smart Grids: EectricalLoad and Wind Power Forecasting • Conclusions
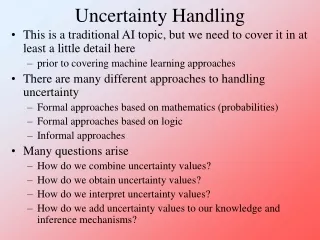
Uncertainty Modeling Methods • Probabilistic Methods • Probability density function • (PDF) & • cumulative distribution function (CDF) • Stochastic models • Stochastic programming • Monte Carlo simulation • Prediction Intervals • the upper bound, lower bound • and the coverage probability. • Fuzzy Logic A fuzzy logic system and its components
Forecasting & Estimation Methods Forecasting methods Point Forecasts Interval Forecasts Prediction Intervals Confidence Intervals Boot Strapping • Point forecasts cannot properly handle the uncertainties associated with data sets. • PIs are excellent tools for the quantification of uncertainties associated with point forecasts and predictions
Prediction Intervals: Most forecasters do realize the importance of providing interval forecasts to enable users to • Assess future uncertainty, • Plan different strategies for the range of possible outcomes indicated by the interval forecast, • Compare forecasts from different methods more thoroughly, and • Explore different scenarios based on different assumptions more carefully.
Confidence Intervals v/s Prediction Intervals: Confidence intervals:are intervals constructed about the predicted value of y,at a given level of x,which are used to measure the accuracy of the mean response of all the individuals in the population. Prediction intervals:are intervals constructed about the predicted value of y that are used to measure the accuracy of a single individual’s predicted value.
Artificial Neural Networks • Feedforward Neural Network using back propagation with momentum learning and adaptive learning rate are often used for forecasting and prediction applications • Thelearning rule modifies the weights according to the input patterns that it is presented with. • In a sense, NNs learn by example as do their biological counterparts. • Neural Network is a powerful tool for non-linear mapping
PIs v/s NN-based Point Forecasting • Prediction intervals (PIs), have been proposed to model uncertainty in forecasting studies. • Advantages of PIs over point forecasting: • When uncertainty exists in the data, such as multi-valued, sparse, noisy datasets or if targets are affected by probabilistic events, the reliability of point forecasts significantly drops. • NN point predictions: only provides predicted values but no information about prediction accuracy; • PIs not only provide a range that targets are highly likely to lie within, but also have an indication of their accuracy (confidence level)
Construction of Neural Network-Based Prediction Intervals Main motivation for construction of PIs is to quantify the likely uncertainty in the point forecasts • Delta Method - The root theory of delta method is nonlinear regression • Bayseian method – NNs are trained based on a regularized cost function • Mean-variance estimation method – assumes that errors are normally distributed around the true mean of targets and estimates the target variance using a NN • Bootstrap Method – Most common; uses an ensemble of NN models to produce a less biased estimate of the true regression of the targets
Construction of Neural Network-Based Prediction Intervals Traditional methods construct PIs in two steps: 1) They regress the given dataset to a specified model or function (which is the same as point forecasts) 2) According to the assumed data distribution, the statistical mean and variance values are calculated • if Jacobian or Hessian matrix are needed, they are also calculated at this step. Based on this information, PIs are then constructed.
Construction of NN-Based Prediction Interval Methods: Disadvantages of traditional methods • Implementation of these methods is complex. • For example, Delta and Bayesian methods need to calculate the Jacobian matrix and Hessian matrix of the parameters in each iteration. • Traditional methods make assumptions about the data distribution. • Delta method assumes that the noises are normally distributed and t-distribution is applied • Mean-variance estimation method assumes that NN (predicting the mean) can precisely estimate the true mean of the targets. • Bootstrap method assumes that an ensemble of NN models will produce a less biased estimate of the true regression of the targets. • Massive computational requirements hinder widespread applications of these methods for decision-making
Construction of NN-Based PIs for Uncertainty Modeling using LUBE method • A new method: • Lower Upper Bound Estimation (LUBE) • NN with two outputs to directly generate the upper and lower bounds. • Makes no assumptions about the dataset • Simpler and avoids calculation of derivatives of NN output with respect to its parameters • Much smaller computational requirements
PI Evaluation Indices • Prediction Interval Coverage Probability (PICP) • Prediction Interval Normalized Average Width (PINAW) • Prediction Interval Normalized Root-mean-square Width (PINRW) • Objective Function
Particle Swarm Optimization (PSO) Takes inspiration from Natural swarms for solving optimization problems Flocks of birds → Particle Swarm Optimization (PSO) Transforms the swarm intelligence metaphor into engineering methodologies to solve optimization and search problems. Powerful Optimizer - Used for optimizing the structure of Neural Network for construction of Pis in this work
Construction of NN-Based PIs for Uncertainty Modeling • Determination of the Optimal NN structure using particle swarm optimization • Velocity and Position Update • Mutation Operator • PI Construction and Evaluation for Training Set • Update pbest and gbest particles • Testing and Evaluation Flow chart of PSO-based LUBE method
Construction of NN-Based PIs for Forecast Uncertainty Modeling Datasets for case studies • Six case studies • 5-fold cross validation for optimal NN structure • Each case study repeats five times 1. Ding10 is a one-dimensional synthetic mathematical function, with the added noise with a heterogeneous distribution. 2. HAS is a five-dimensional synthetic mathematical function. Unlike case study 1, the added noise is normally distributed with a constant variance. 3. Dry bulb temperature (DBT) comes from an industrial dryer sampled every ten seconds. Three inputs are used for estimating the output of dry bulb temperature. 4. Data in case study 4 comes from a medical study, which contains 315 observations on 14 variables. This study tries to investigate the relationship between personal characteristics, dietary factors, and plasma beta-carotene. 5. T70 comes from a real baggage handling system, which is frequently affected by probabilistic events. The target is to forecast the travel time for 70% of each flight bags (T70). 6. T90 is similar to T70. It represents the travel time for 90% of each flight bags (T90). The level of uncertainty for T90 is higher than T70.
Construction of NN-Based PIs for Forecast Uncertainty Modeling Parameters for PSO and CWC Median CWC vs. NN structure for DBT
Construction of NN-Based PIs for Forecast Uncertainty Modeling CWC of the gbest particle in each generation of PSO. The constructed PIs of the 6 case studies. • The cost function can converge to a sufficient small CWC. • A sharp drop at the beginning, plateaus in the middle, finally (near) optimal • Indication: the strong searching ability of the PSO + mutation operation
Construction of NN-Based PIs for Forecast Uncertainty Modeling PI evaluation indices and construction time for test samples • For all case studies, the assigned confidence level (90%) can be satisfied. • The median PINAWs are also smaller compared with benchmarks • Percentage CWCs improvement: 26.55%, 28.91%, 29.04%, 18.93%, 41.12% and 6.60% • All PI construction time for test samples are less than 0.1ms, so the algorithm is fast and efficient. • In conclusion, the proposed PSO-based LUBE method can construct higher quality PIs in a simpler and faster manner.
Uncertainty Modeling in Smart Grids with Intermittent Renewable Generation
PIs for Electrical Load Forecasting • Datasets and Correlation Analysis • Real load data from Singapore (SG) & New South Wale (NSW), Australia; • Five years’ data, from Year 2007 to 2011, half an hour, each day 48 load points; • Correlation analysis: first three years, validation and test: fourth year and last year data; • Input selection: PACF (Partial Autocorrelation function) and ACF (Autocorrelation function), first seasonal differenced: • y(t)-y(t-48*7), (T=48*7).
Datasets and Correlation Analysis • One week (48*7=336 points) ahead load forecasting, the top 15 peak lagged values as the inputs of the NN. PIs for Electrical Load Forecasting PACF results of SG and NSW load Correlation analysis of SG load • H. Quan, D. Srinivasan, and A. Khosravi, “Uncertainty handling using neural network-based prediction intervals for electrical load forecasting,” Energy, vol. 73, pp. 916-925, Aug. 2014.
PIs for Electrical Load Forecasting • Determination of Optimal Structure of the NN • Two hidden-layered NN, where 1≤n1≤10, 1≤n2≤10; • Singapore load, the best NN structure is 16-5-1-2, NSW load, the best NN structure is 16-8-1-2. NN structures of SG and NSW load data • H. Quan, D. Srinivasan, and A. Khosravi, “Uncertainty handling using neural network-based prediction intervals for electrical load forecasting,” Energy, vol. 73, pp. 916-925, Aug. 2014.
PIs for Load Electrical Forecasting • Constrained single objective optimization • The PICPs for both SG and NSW load are high (>90%) • H. Quan, D. Srinivasan, and A. Khosravi, “Uncertainty handling using neural network-based prediction intervals for electrical load forecasting,” Energy, vol. 73, pp. 916-925, Aug. 2014.
Variability of solar power output There is a great deal of uncertainty associated with solar power generation
The variable nature of wind power The output from a wind farm can be highly unpredictable
Uncertainty Modeling in Smart Grids with Intermittent Renewable Generation • Uncertainty Representation in Smart Grids • Solar generating sources • Solar irradiance distribution • Power outputs • Wind generating sources • Wind speed distribution • Uncertain power curve Beta probability distributions (solar) Empirical power curve Weibull probability distributions (wind)
Uncertainty Modeling in Smart Grids with Intermittent Renewable Generation • High uncertainty of wind and solar power has significant impact on power system operation, economics, and reliability • Existing forecasting methods cannot adequately represent this uncertainty • PIs for decision making and risk assessment • To develop advanced uncertainty modeling methods for forecasting; • To incorporate renewable generation forecast uncertainties into stochastic decision making and risk assessment.
Uncertainty Handling Using NN-Based PIs for Wind Power Forecasting • Improved PSO-based LUBE method, PSO associated with mutation operator • Different types of prediction tasks, including electrical load and wind power generation forecasts are implemented • Outperforms ARIMA, exponential smoothing (ES) and naive models • Implementation is straightforward and much easier; PI construction time is much shorter than traditional methods.
Uncertainty Handling Using NN-Based PIs for Wind Power Forecasting • Primary problem: multi-objective, higher PICP and narrower width • Single-Objective Problem Formulation, cost function of CWC • Constrained Single-Objective Problem Formulation • Advantages: closer to the primary problem, fewer parameters • H. Quan, D. Srinivasan, and A. Khosravi, “Incorporating wind power forecast uncertainties into stochastic unit commitment using neural network-based prediction intervals,” IEEE Transactions on Neural Networks and Learning Systems, Nov. 2014.
Uncertainty Handling Using NN-Based PIs for Wind Power Forecasting • Case Studies—Datasets and Correlation Analysis • Dataset: • Capital Wind Farm, day-ahead forecasting • Correlation Analysis: • Seasonal Differencing • ACF and PACF analysis • NN input selection
Uncertainty Handling Using NN-Based PIs for Wind Power Forecasting • Results PICP and PINRW of gbest during training for SG load PICP and PINRW of gbest during training for NSW load • The training process: simply converges • PICP of gbest: a few changes at beginning, it quickly reaches the pre-assigned value. • PINRW of gbest: decreases sharply at the beginning, then reduces step by step, finally its optimal value. PICP and PINRW of gbest during training for Captl WF
Uncertainty Handling Using NN-Based PIs for Wind Power Forecasting • Constructed lower and upper bounds can cover the real values in a great percentage. • The wind power uncertainty, much higher Captl WF weekly generation and PIs for testing (1-7 Oct. 2010)
Uncertainty Handling Using NN-Based PIs for Load & Wind Power Forecasting • Results and Discussions—Results Comparison Test results of the Proposed Method and Benchmark Models CWC Percentage Improvements • The widths of PIs reflects the level of uncertainty in the data • PI construction time is very short • Significant improvements to benchmarks • Strong repeatability and stability • For all cases, the assigned confidence level 90% can be satisfied H. Quan, D. Srinivasan, and A. Khosravi, “Short-term load and wind power forecasting using neural network-based prediction intervals,” IEEE Transactions on Neural Networks and Learning Systems, vol. 25, no. 2, pp. 303-315, Feb. 2014.
Uncertainty Handling Using NN-Based PIs for Load & Wind Power Forecasting • The primary multi-objective problem is successfully transformed into a constrained single-objective problem. • Not only the high PICP and narrow PINAW are obtained, but also the PI construction time remains short. • In conclusion, the proposed PSO-based LUBE method constructs higher quality PIs for load and wind power forecasts in a short time.
Incorporating Forecast Uncertainties into Stochastic Decision Making process • The computational framework quantifies all grid uncertainties • The integration framework is validated on the stochastic scheduling • Generation costs, reserves of different scheduling strategies, risk profiles are considered H. Quan, D. Srinivasan, and A. Khosravi, “A computational framework for uncertainty integration in stochastic unit commitment with intermittent renewable energy resources,” Applied Energy , 2016.
Incorporating Wind Power Forecast Uncertainties into Stochastic Decision Making • Scenario Generation from the Wind Power PIs • Obtain the discrete points on ECDF • Fitting the ECDF curve • Wind power prediction intervals • Decompose PIs into quantiles A list of PIs for day-ahead wind forecasting The fitted ECDF curve
Incorporating Solar Power Forecast Uncertainties into Stochastic Decision Making • Stochastic Model for Uncertainty Integration, Solar and Wind • Net load • New Power Balance Constraint • GA-Based Solution Method • 5 deterministic and 4stochastic cases A list of PIs for day-ahead solar power forecasting The generated 50 solar scenarios for 24 hours
A Computational Framework for Uncertainty Integration with Renewable Generation • Load, wind and solar power uncertainties, generator outages are considered • Five deterministic and four stochastic case studies, different UC and reserve strategies • Superimposed effect of uncertainties in uncertainty integration • The overall costs are less due to solar power penetration • Stochastic VS. deterministic model: more robust • Power systems run higher level of risk in peak load hours Real time ED reserve of Det. cases. Real time ED reserve of Stoch. cases. H. Quan, D. Srinivasan, and A. Khosravi, “Integration of renewable generation uncertainties into stochastic unit commitment considering reserve and risk: a comparative study,” Energy Journal, 2016.
Conclusions • Prediction Intervals are powerful for quantifying forecast uncertainties • Advanced Uncertainty Handling Methods for Forecasting • PSO-based LUBE method shows significant improvements on quality of PIs and computational speed. • Pis can be effectively used for Incorporation of Forecast Uncertainties in Decision Making • A computational framework for uncertainty integration in Smart Grid has been developed; incorporates deterministic and stochastic scheduling, and reserve strategies considering risk