Download
1 / 17
170 likes | 257 Vues
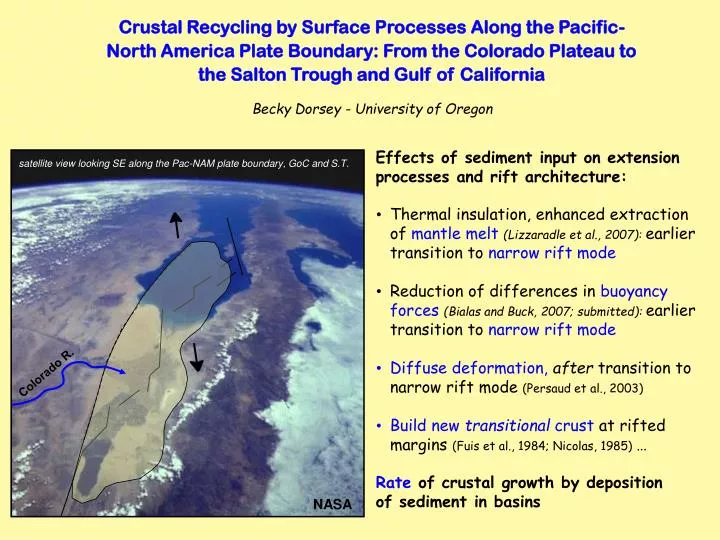
satellite view looking SE along the Pac-NAM plate boundary, GoC and S.T. Colorado R. NASA. Crustal Recycling by Surface Processes Along the Pacific-North America Plate Boundary: From the Colorado Plateau to the Salton Trough and Gulf of California. Becky Dorsey - University of Oregon.

E N D
satellite view looking SE along the Pac-NAM plate boundary, GoC and S.T. Colorado R. NASA Crustal Recycling by Surface Processes Along the Pacific-North America Plate Boundary: From the Colorado Plateau to the Salton Trough and Gulf of California Becky Dorsey - University of Oregon Effects of sediment input on extension processes and rift architecture: • Thermal insulation, enhanced extraction of mantle melt(Lizzaradle et al., 2007): earlier transition to narrow rift mode • Reduction of differences in buoyancy forces(Bialas and Buck, 2007; submitted): earlier transition to narrow rift mode • Diffuse deformation, after transition to narrow rift mode (Persaud et al., 2003) • Build new transitional crust at rifted margins (Fuis et al., 1984; Nicolas, 1985) … Rate of crustal growth by deposition of sediment in basins
SOURCE - Colorado River: Catchment Area: 630,000 km2 (4th largest in conterminous U.S.) Dissolved Load (TDS): ~ 400 ppm (early 1900’s) ~ 800 ppm (modern) Sediment Discharge: 1.2-1.5 x 10⁸ t/yr (pre-dam) ~ 1.0 x 10⁵ t/yr (modern) Total Sediment Volume Eroded: ~ 230,000 - 294,000 km3 (assuming pre-dam discharge over 5.3 m.y.)… work in progress (J. Pederson) SINK - Basins in Salton Trough and northern Gulf of California Volume ? Age ? Crustal Growth Rate ? Implications for Rifted Margins ? • Why Sediment Budgets ? • Regional mass balance and landscape evolution • Rates & processes of erosion in source, dynamic feedbacks with tectonic & climate drivers • Efficiency of mass transfer to basins • Ultimate distribution & fate of sediments • Understand processes of crustal recylcing
Pliocene Oldest C-Sst = 5.3 Ma Miocene micropaleontology (K. McDougall) Fish Creek - Vallecito Basin (FCVB) Ongoing work with Mike Oskin, Tom Peryam, Kim Le: basin evolution and controls on progradation 2.65 and 2.60 Ma
Pre-Miocene Pliocene- Quaternary post - 6 Ma (Spencer et al., 2001) post - 5.5 Ma (House et al., 2005) D.D. ~ 200 kyr. 5.3 Ma Basin and Range S.N. Colorado Plateau (North America) E C S Z Pacific Plate
Paleocurrent Data 192° Colorado River sandstone: impressive in outcrop, lots of good information. But …
… most Colorado R. sediment is buried in subsurface basins (Pliocene to modern). What is the volume of sediment in subsurface basins? Where to look? Guaymas Basin is sediment-rich compared to southern Gulf, but …Most sediment in Guaymas Basin derived from rivers in Sonora, not Colorado River (Curray et al., 1982; Einsele and Niemitz, 1982).
Preliminary analysis … (1) 30 x 60 km Depth of the basins? Fuis et al. (1984) Answer is model-dependent … (2) 55 x 75 km (3) 50 x 160 km Pacheco et al. (2006) (4) 0.5 * (65 x 160 km) (5a) 65 x 180 km Aragon & Martin (2007) Gonzalez et al. (2005) (5b) 40 x 90 km (6) 50 x 120 km (5c) 20 x 34 km Estimate volume of C.R. sediment in subsurface
Bracket the estimate using two crustal models: (1) Lithosphere is fully ruptured, therefore:Sed basins are 5 km deep, basement consists of [sediments + mafic intrusions] (Fuis et al., 1984) Salton Trough 5 km 12 km Fuis and Mooney (1991) Schmitt and Vasquez (2006)
Bracket the estimate using two crustal models: (2) Lithosphere is not fully ruptured, therefore:Sed basins are 5 km deep, and basement consists of thinned continental crust This model is suggested by relatively shallow depth to crystalline basement in southern Salton Trough (Pacheco et al., 2006). … large unknowns, under-constrained problem. Pacheco et al. (2006)
Northern and Central Salton Trough Salton Trough 5 km 12 km Fuis and Mooney (1991) Depth of Basin Fill: Minimum = 5 km … Assumes average sed accum rate of ~0.9-1.0 mm/yr (less than half of rate measured in upper 1.7 km) Maximum = 12 km (between 5 and 12 km depth, assume crust is composed of half sediment and half mafic intrusions) Assumes net sed accum rate of ~ 2.2-2.3 mm/yr: same as rate based on 0.76-Ma Bishop ash at 1.7 km (Herzig et al., 1988). Area (1 + 2): = 5,925 km2 Volume of Sediments (areas 1 & 2): Minimum = 29,625 km3 Maximum = 50,363 km3 (1) 30 x 60 km (2) 55 x 75 km
Southern Salton Trough Buried detachment fault in Altar Basin Pacheco et al. (2006) Pacheco et al. (2006) Depth of Basin Fill: 3. Altar Basin: 4 km (use one value) 4. Basin SW of CPF: minimum = 5 km maximum = 12 km (5-12 km = 50% seds) Area (3 + 4): = 13,200 km2 Volume of Sediments(areas 3 + 4): Minimum = 58,000 km3 Maximum = 76,200 km3 Pacheco et al. (2006) (3) 50 x 160 km (4) 0.5 * (65 x 160 km)
Northern Gulf of California Delfin Basin Tiburon Basin sediments sediments 5 km sediments + mafic intrusions? 10 km lower crust, looks “continental” (?) Gonzalez et al. (2005) Depth of Basin Fill: Minimum = 5 km Maximum = 10 km (5-10 km = 50% seds) Area (5): = 15,980 km2 Volume of Sediments (area 5): Minimum = 79,900 km3 Maximum = 119,850 km3 (5a) 65 x 180 km Gonzalez et al. (2005) (5b) 40 x 90 km (5c) 20 x 34 km
Tiburon Basin Aragon & Martin (2007) Depth of Basin Fill: Minimum = 5 km (Aragon and Martin, 2007) Maximum = 10 km (5-10 km = 50% seds) (Gonzalez et al., 2005) Area (6): = 6,000 km2 Volume of Sediments (area 6): Minimum = 30,000 km3 Maximum = 45,000 km3 Gonzalez et al. (2005) (6) 50 x 120 km
(1) 30 x 60 km Fuis et al. (1984) (2) 55 x 75 km (3) 50 x 160 km Pacheco et al. (2006) (4) 0.5 * (65 x 160 km) (5a) 65 x 180 km Aragon & Martin (2007) Gonzalez et al. (2005) (5b) 40 x 90 km (6) 50 x 120 km (5c) 20 x 34 km Sum the calculations: (1) Total volume of C.R. sediment in subsurface: ~ 197,925 - 291,815 km3 Very rough estimate, lots of room for improvement. (2) Slight adjustment, convert to equivalent rock volume: ~ 182,700 - 280,590 km3 (3) Compare to rock eroded from Colorado Plateau: ~ 230,000 - 294,000 km3 (also very approximate)
Rate of Crustal Growth by input of sediment to the Salton Trough & N. Gulf of California: = volume / time / distance along strike = 182,700 - 280,590 km3 / 5.3 m.y. / 580 km along strike = 59 - 91 km3 / m.y. / km Compare to growth rates at seafloor spreading centers: = 50 - 160 km3 / m.y. / km (for slow and v. slow spreading rates) = 250 - 800 km3 / m.y. / km (for medium to fast spreading rates) Compare to rates at subduction-related magmatic arcs: = 25 - 67 km3 / m.y. / km (Philippines) = 30 - 95 km3 / m.y. / km (other west Pacific arcs) = 80 - 200 km3 / m.y. / km (Izu-Bonin arc)
Implications: Gulf of Cal. & Salton Trough: • Highlights difference between the alternate crustal models. Will affect future attempts at sediment budget. • “Novel type of crust” produced by rifting: intermediate velocities reflect mix of seds and mafic intrusions(Fuis et al., 1984; Nicolas, 1985). Crustal recycling by surface processes: Erosion, transport, and deposition of seds in basins • Important mechanism of crustal growth. Similar in scale and rate to magmatic accretion at subduction zones and slow spreading centers. • May occur at other rift and oblique-rift margins where large continental river is captured by subsidence of a pre-existing orogenic highland.