Download
1 / 33
330 likes | 337 Vues
Vertebrate Evolution: A look at biomolecular evidence using gel electrophoresis. Part 1: Introduction. Available online at www.redwood.org/stewart. Classification Kingdom Phylum Class Order Family Genus Species. Traditional classification based upon traits : structure

E N D
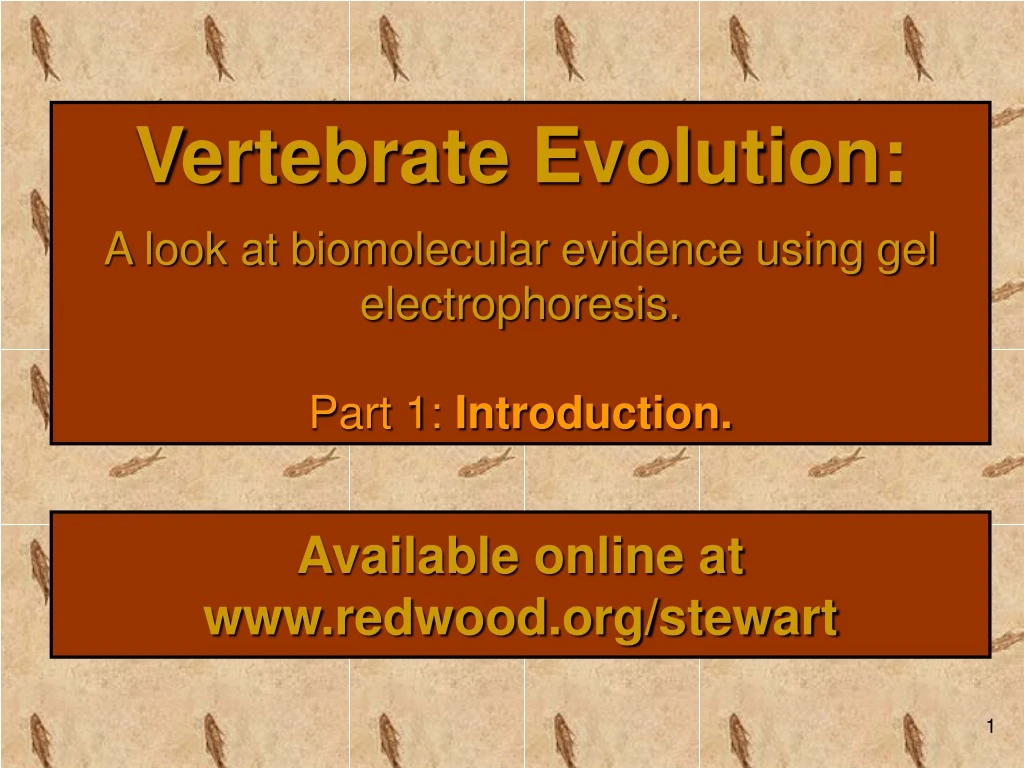
Vertebrate Evolution:A look at biomolecular evidence using gel electrophoresis. Part 1:Introduction. Available online at www.redwood.org/stewart
Classification Kingdom Phylum Class Order Family Genus Species Traditional classification based upon traits: structure function (behavior) I. Traditional Method for Classifying Organisms: Structure and Function
II. Using biomolecular evidence to determine evolutionary relationships. A. Biomolecules are the basis of traits • Traits represent organisms': - Structure - Function • Proteins determine structure and function • DNA codes for proteins that confer traits
A. Biomolecules are the basis of traits DNA RNA Protein Trait • DNA TAC CGA TCG TGA ACT • TRANSCRIPTION • mRNA AUG GCU AGC ACU UGA • TRANSLATION • tRNA UAC CGA UCG UGA ACU • amino acid Met - Ala - Ser -Thr - Stop
A. Biomolecules are the basis of traits End Product of Transcription and Translation: Proteins Before you begin a lab to use bio-molecular evidence to determine the evolutionary relationships of organisms, let’s take a closer look at proteins.
Type of Protein Function Example Structural Protein Support ØKeratin is the protein of hair, horns, feathers Ø Collagen and elastin provide a fibrous framework in animal connective tissue • Insects and spiders use silk fibers to make their cocoons and webs
Type of Protein Function Example StorageStorage of Amino Acids • Ovalbumin is the protein of egg white, used for developing embryos • Casein – milk protein for developing babies • Plants have storage protein in their seeds
Type of Protein Function Example Transport Transport of other substances • Hemoglobin – iron containing protein of blood • Other proteins transport molecules across cell membranes
Type of Protein Function Example Hormonal Coordination of activities • Insulin, a hormone secreted by the pancreas, helps regulate blood sugar
Type of Protein Function Example Receptor Response of cell to chemical stimuli • Receptors built into the membrane of nerve cell detect chemical signals release by other nerve class
Type of Protein Function Example Contractile Movement • Actin and myosin are responsible for movement of muscles • Other protein are responsible for cilia and flagella of organelles
Type of Protein Function Example DefensiveProtection against disease • Antibodies combat bacteria and viruses
Type of Protein Function Example Enzymatic Acceleration of chemical reactions • Digestive enzymes break down food
B. Biomolecular Differences • Changes in DNA changes in protein, these changes result in: - different functions - unique traits - positive (for survival), negative (for selection), or no effects • Genetic diversity provides pool for natural selection = evolution
C. Levels of Protein Organization Protein Structure A functional protein is not just a polypeptide chain! Polypeptide chain (yarn) – not functional
C. Levels of Protein Organization Protein Structure A functional protein is not just a polypeptide chain! Protein (sweater) –functional polypeptide chain
C. Levels of Protein Organization 1. Primary Structure - Proteins begin as a straight chain of amino acids. 2. Secondary Structure - The chains begin to bend and twist like a corkscrew or a flat folded sheet. Primary Secondary
Tertiary Quaternary C. Levels of Protein Organization 3. Tertiary Structure - The twisted chain folds even more and bonds form, holding the 3-dimensional shape. 4. Quaternary structure - Several amino acid chains in the tertiary structure come together. This is a functional protein.
D. Comparing Protein Size 1. What do you compare? • Dalton (Da) = mass of hydrogen molecule = 1.66 x 10 -24 gram • Avg. amino acid = 110 Da • Protein size measured in kilodaltons (kDa) • Avg. protein = 1000 amino acids = 100,000 daltons = 100 kDa
1. What do you compare? • Muscle contains proteins of many sizes ProteinkDaFunction titin 3000 center myosin in sarcomere dystrophin 400 anchoring to plasma membrane filamin 270 cross-link filaments into gel myosin heavy chain 210slide filaments spectrin 265 attach filaments to plasma membrane nebulin 107 regulate actin assembly a-actinin 100 bundle filaments gelosin 90 fragment filaments fimbrin 68 bundle filaments actin42form filaments tropomyosin 35 strengthen filaments myosin light chain 27slide filaments troponin (T, I, C) 30, 19, 17 mediate regulation of contraction thymosin 5 sequester actin monomers
1. What do you compare? • Example proteins • Actin: • 5% of total protein • 20% of vertebrate muscle mass • 375 amino acids = 42 kDa • Forms filaments • Myosin: • Tetramer of two heavy subunits (220 kDa) and two light subunits (20 kDa) • Breaks down ATP for muscle contraction
D. Comparing Protein Size 2. How compare? • Break protein complexes into individual protein chains (using chemicals) • Denature proteins so they lose their shape and gain a charge (using detergent and heat) • Separate proteins based on size (using gel electrophoresis)
III. Vertebrate Protein Analysis Lab A. the Experiment • Purpose: Compare muscle proteins from related and unrelated vertebrates to determine evolutionary relationships. • Procedure: - Extract proteins from tissue - Denature proteins - Separate proteins by size using polyacrylamide gel electrophoresis (PAGE) - Stain proteins to see banding patterns - Analyze and interpret results
Put muscle in buffer which includes:- SDS detergent (Sodium Dodecyl Sulfate) to solubilize and denature proteins and negative charge to proteins- Reductants (beta-mercaptoethanol, DTT) break disulfide bonds Heat muscle/buffer mixture to denature proteins B. How does a PAGE gel work? 1. Prepare the Protein Samples
Negatively charged proteins move to positive electrode Smaller proteins move faster Proteins separate by size Simulation A, B, s-s SDS, ß-Me, heat - + proteins with SDS B. How does a PAGE gel work? 2. Run the gel Vert. 1 Vert. 2 Marker
Compare banding patterns among the vertebrates - identify similarities and differences among them. Illustrate the relationships among the vertebrates . Compare illustration based on biomolecular evidence to an illustration based on traditional classification DO THEY MATCH? B. How does a PAGE gel work? 3. Analyzing Results End Part 1
Vertebrate Evolution:A look at biomolecular evidence using gel electrophoresis. Part 2:Analysis. Available online at www.redwood.org/stewart
15% SDS-PAGE Lane 1: Tunicate Lane 2: Fish Lane 3: Amphibian Lane 4: Reptile Lane 5: Bird Lane 6: Mammal Lane 7: Actin/myosin 1 2 3 4 5 6 7 Gel Analysis
kDa mm Molecular Weight Analysis 203 8.5 135 12.0 86 18.5 41 28.0 33 34.0 19 41.5 8 44.5
Vertebrate Protein Gel Analysis Marker Pig Perch Turtle Tunicate Frog Pigeon
Fish Protein Gel Analysis Marker Pig: arguably, most complex vertebrate (top right of cladogram) Perch Turtle Tunicate Frog Pigeon Myosin (210 kDa) = about 2000 am. acids * Do bands line up? Measure and record distances in mm To make your vertebrate cladogram, compare each vertebrate to the pig by: 1. measuring distance protein bands traveled from wells,2. recording (to scale) on paper (IMPORTANT: relative position of bands),3. counting number of proteins each vertebrate has in common with pig*.
Cladogram More complex Family tree that branches systematically at points (nodes) representing specific traits possessed by some groups, but not others. Organisms branching to right HAVE this trait. Branches: Organisms Recent/ derived traits Organisms branching to left DO NOT have this trait. Node: Specific trait (or # of proteins in common). Primitive traits Less complex