Download
1 / 57
570 likes | 839 Vues
Data visualization and graphic design Introducing R for data visualization. Allan Just and Andrew Rundle EPIC Short Course June 21, 2011. Wickham 2008. Intro to R. Objectives After this class, participants will be able to: Describe some capabilities and uses of R

E N D
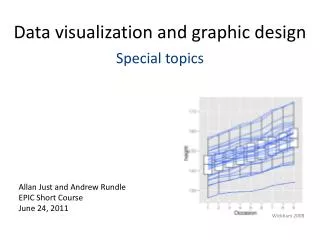
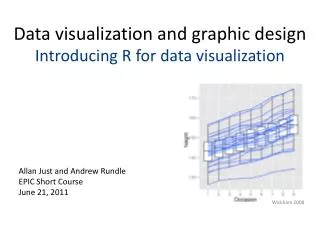
Data visualization and graphic design Introducing R for data visualization Allan Just and Andrew Rundle EPIC Short Course June 21, 2011 Wickham 2008
Intro to R Objectives After this class, participants will be able to: • Describe some capabilities and uses of R • Search for help within R and use good coding practices for reproducible research in R • Read in and summarize a simple dataset with R/JGR/Deducer • Make some standard plots with Deducer templates
What is R? nytimes.com
R has many uses • Work with data: subset, merge, and transform datasets with a powerful syntax • Analysis: use existing statistical functions like regression or write your own • Graphics: graphs can be made quickly during analysis and polished for publication quality displays
Why learn a whole language to look at data versus Excel? • Recreate/redo your exact analysis • Automate repetitive tasks • Access to statistical methods not available in Excel • Graphs are more elegant
Why R versusSAS, SPSS, or Stata? • It's free! • It runs on Mac, Windows, and Linux • It has state-of-the-art graphics capabilities • It contains advanced statistical routines not yet available in other packages – a de facto standard in statistics • Can program new statistical methods or automate data manipulation/analysis adapted from statmethods.net
Made in SAS Redone in R learnr.wordpress.com
Forest plot to compare parameter estimates from many models
Choropleth map Shapefile: CIESIN, Columbia University Asthma data: http://nyc.gov/html/doh/downloads/pdf/asthma/asthma-hospital.pdf
Intro to R: recap Objectives After this class, participants will be able to: • Describe some capabilities and uses of R Statistical data analysis Automation (scripting) of functions to work with data Elegant graphics to facilitate data visualization • Search for help within R and use good coding practices for reproducible research in R • Read in and summarize a simple dataset with R/JGR/Deducer • Make some standard plots with Deducer templates
Learning a new language is difficult flickr.com/photos/dnorman/3732851541/
What makes R difficult to learn R is designed to be flexible and powerful rather than simple but limited. R is a fully featured language mainly used from the command line. Learning the commands and the structure of the code takes time and practice. If I made a a typo you would know what I meant...
What makes R difficult to learn R is designed to be flexible and powerful rather than simple but limited. The solution: be careful build code in simple pieces and test as you go (learn to debug). Reuse code that works. Use helpful resources. Consider an alternative GUI for R.
Getting help in R You can call for help on a function with a leading question mark and leaving off the () ?functionname Search online statmethods.net An Introduction to R in Windows found under Help – Manuals (in PDF)
Suggestions for an R workflow Save the bits of your code that work in a text editor - building a script of clean code that works from start-to-finish. With clean code instead of transformed data files it is easier to redo analyses if your data are updated or you want to change an earlier step Leave yourself informative comments # everything to the right of the pound sign # is unevaluated Using spaces and indents can help readability Use meaningful names for objects Reproducible research!
Intro to R: recap Objectives After this class, participants will be able to: • Describe some capabilities and uses of R • Search for help within R and use good coding practices for reproducible research in R ?t.test will bring up R help Free manuals online: Introduction to R Also: statmethods.net #use comments; save the code that works to reproduce your results • Read in and summarize a simple dataset with R/JGR/Deducer • Make some standard plots with Deducer templates
Learning the languageMany important features • Arithmetic and logical operators: +, <, … • Data types: numeric, logical, … • Data structures: vectors, matrices, … • Functions – always end with (): median(x)
Using R as a calculator Mathematical operators + - / * ^ log() abs()
R can evaluate logical expressions == equal != not equal & and | or (vertical pipe) 10 < 20 [1] TRUE pi > 3 & 2^2 == 4 [1] TRUE "This" != "That" [1] TRUE
Creating new objects Assignment operator is <- (looks like an arrow) x <- 10 “Set x to take the value 10” The symbols in this operator must be adjacent. x < - 10 What does this do? You can overwrite old values x <- x^2 “Set x to take the value x2”
Indexing and subsetting Concatenate function is c() x <- c(10, 20, 30) x [1] 10 20 30 Refer to components of objects by a position index which goes between square braces x[2] return the second position in x [1] 20 x[c(1, 2)] return the first and second position in x [1] 10 20 x[-3] return all except the third position in x [1] 10 20 What wouldx[c(3, 2)]return?
Data frames A data frame is a rectangular collection of data Rows: observations Columns: variables diamonds <- data.frame(carat, cut, price) carat cut price 1 0.23 Ideal 326 2 0.21 Premium 326 3 0.23 Good 327 4 0.29 Premium 334 5 0.31 Good 335 6 0.24 Very Good 336
Data frames You can extract the variables as vectors with a $ diamonds$cut You can also index by position (or name) with square braces diamonds[2, 3] returns the single value in row 2, column 3 An empty index is treated like a wildcard and corresponds to all rows or columns depending on position diamonds[, "cut"] (same result as diamonds$cut) How would you return the first three rows and all columns? row, column
R functions Thousands of functions are built-in: median() lm() linear model t.test() chisq.test() or make your own: inch.to.cm <- function(x){x * 2.54} inch.to.cm(74) [1] 187.96
Missing values These take a value of NA Can be in a data object of any type (logical, numeric, character) By default operations on NA will return NA NA == NA [1] NA Can check for NA with is.na() y <- c(2, 10, NA, 12) is.na(y) [1] FALSE FALSE TRUE FALSE Can often pass na.rm = T option to remove NA values in operations mean(y) [1] NA mean(y, na.rm = T) [1] 8
R has several thousandadditional packages time series survival spatial machine learning bioinformatics Interfaces to Excel, SQL databases, Twitter, google maps…
Installing a package • Open up R • Click in to the console window and type: install.packages() • Select a mirror (anywhere in the US) • Find and select "Deducer" and choose OK. • This will download Deducer and the other packages which it requires, including ggplot2.
Recap on GUIs R Default Windows GUI: lacks additional features to make learning or programming easier JGR: Makes programming easier with syntax highlighting and command argument suggestions. No menus for stats. Looks the same across platforms (Java based) Deducer: Adds menus for basic stats to JGR. Menu driven graphics options (building with ggplot2).
R graphics – 3 main "dialects" Base: with(airquality, plot(Temp, Ozone)) Lattice: xyplot(Ozone ~ Temp, airquality) ggplot2: ggplot(airquality, aes(Temp, Ozone)) + geom_point( )
ggplot2 philosophy Written by Hadley Wickham (Rice Univ.) Extends The Grammar of Graphics (Wilkinson, 2005) All graphs can be constructed by combining specifications with data (Wilkinson, 2005). A specification is a structured way to describe how to build the graph from geometric objects (points, lines, etc.) projected on to scales (x, y, color, size, etc.)
ggplot2 philosophy When you can describe the content of the graph with the grammar, you don’t need to know the name of a particular type of plot… Dot plot, forest plot, Manhattan plot are just special cases of this formal grammar. …a plotting system with good defaults for a large set of components that can be combined in flexible and creative ways…
Building a plot in ggplot2 data to visualize (a data frame) map variables to aesthetic attributes geometric objects – what you see (points, bars, etc) scales map values from data to aesthetic space faceting subsets the data to show multiple plots statistical transformations – summarize data coordinate systems put data on plane of graphic Wickham 2009
A basic ggplot2 graph ggplot(airquality) + geom_point(aes(x = Temp, y = Ozone)) Aesthetics map variables to scales Data Geometric objects to display
A ggplot2 graph is an R object p <- ggplot(airquality) + geom_point(aes(x = Temp, y = Ozone)) str(p) #structure of p List of 8 $ data :'data.frame': 153 obs. of 6 variables: ..$ Ozone : int [1:153] 41 36 12 18 NA 28 23 19 8 NA ... ..$ Solar.R: int [1:153] 190 118 149 313 NA NA 299 99 19 194 ... ..$ Wind : num [1:153] 7.4 8 12.6 11.5 14.3 14.9 8.6 13.8 20.1 8.6 ... ..$ Temp : int [1:153] 67 72 74 62 56 66 65 59 61 69 ... ..$ Month : int [1:153] 5 5 5 5 5 5 5 5 5 5 ... ..$ Day : int [1:153] 1 2 3 4 5 6 7 8 9 10 ... $ layers :List of 1 ..$ :proto object .. .. $ mapping :List of 2 .. .. ..$ x: symbol Temp .. .. ..$ y: symbol Ozone .. .. $ geom_params:List of 1 .. .. ..$ na.rm: logi FALSE . . . $ plot_env :<environment: R_GlobalEnv> - attr(*, "class")= chr "ggplot" Note that the internal plot specification includes the data So if you update the data, update the call to ggplot() shortened substantially
Help with learning ggplot2 Website: had.co.nz/ggplot2/ Thousands of examples! Book: ggplot2: Elegant Graphics for Data Analysis Hadley Wickham, 2009 Graphic User Interface: Deducer(R package) Ian Fellows
Intro to R: recap Objectives After this workshop participants will be able to: • Describe some capabilities and uses of R • Search for help within R and use good coding practices for reproducible research in R • Read in and summarize a simple dataset with R/JGR/Deducer Together, let’s explore some data from the WHO - Global School Health Survey. I will also give you ascript containing code which you can run, modify, and take home! • Make some standard plots with Deducer templates