Download
1 / 15
150 likes | 237 Vues
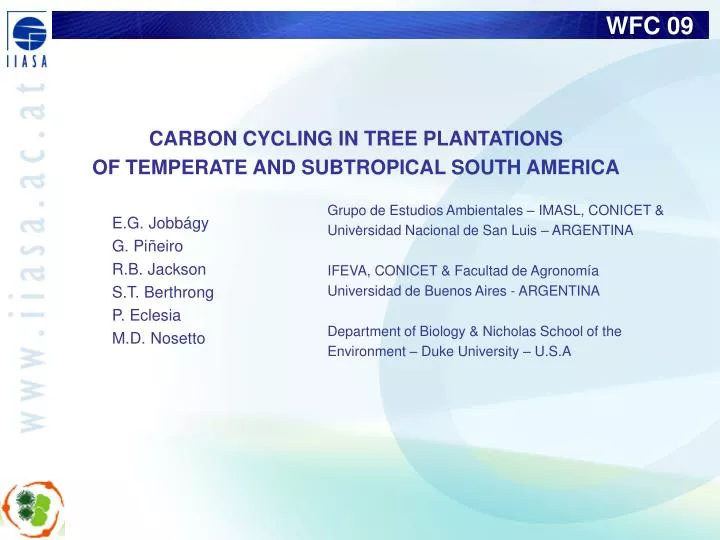
CARBON CYCLING IN TREE PLANTATIONS OF TEMPERATE AND SUBTROPICAL SOUTH AMERICA. Grupo de Estudios Ambientales – IMASL, CONICET & Universidad Nacional de San Luis – ARGENTINA IFEVA, CONICET & Facultad de Agronomía Universidad de Buenos Aires - ARGENTINA

E N D
CARBON CYCLING IN TREE PLANTATIONS OF TEMPERATE AND SUBTROPICAL SOUTH AMERICA . Grupo de Estudios Ambientales – IMASL, CONICET & Universidad Nacional de San Luis – ARGENTINA IFEVA, CONICET & Facultad de Agronomía Universidad de Buenos Aires - ARGENTINA Department of Biology & Nicholas School of the Environment – Duke University – U.S.A E.G. Jobbágy G. Piñeiro R.B. Jackson S.T. Berthrong P. Eclesia M.D. Nosetto
Tree plantations in South America Fast growing species for commercial purposes eucalypts, pines, poplar-willows First wave in the 70s, second wave in the 90s declining native resources substitution of imports public subsidies globalization of markets Ecological & economic opportunity very high productivity (high yield / short shifts) suitable land with low opportunity cost afforestation foci in the subtropical & temperate zone grasslands emerge as THE key “forestry” biome (!) EXAMPLE: Output of forest products in Argentina (statistics for 2002) native forests →~1 M Tn y-1 on 34 M Ha planted forests on grasslands → ~1 M Tn y-1 on 0.5 M Ha
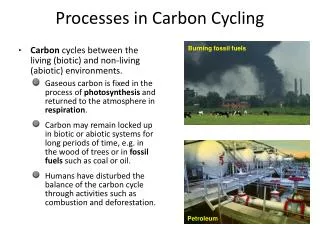
C uptake (NPP) Harvest Fire Herbivory biomass Fire Erosion Herbivory / Decomposition forest floor Decomposition soil organic matter
C uptake (NPP) biomass forest floor soil organic matter
Net primary production TREE PLANTATION vs. PREVIOUS COVER as suggested by NDVI from AVHRR-NOAA Media histórica 1982-1999 LONG TERM AVERAGE 1982-1999 AR BR BR CH BR CH CH AR Independent field data suggests a 2-3 fold increase of aboveground NPP NPP rates are by far the highest of any other cultivated land use AR-UR BR BR NDVI tree plantation BR VZ EC NDVI adjacent zones (control) Baldi et al. 2008. Ambiencia (Brasil) Nosetto et al. 2008. Global Biogeochemical Cycles Jobbágy et al. Agrociencia 2006 Subtrop humid forest dry forest temp humid forest temp grassland trop grassland
C uptake (NPP) Gains under commercial, high density, fastest growing species schemes: 5-15 Tn/Ha/yr in humid zones 1-3 Tn/Ha/yr in semiarid zones Shorter shifts than in the Northern Hemisphere: 10-20 yrs in warm/humid zone Still under expanding face (planted area > harvested area) Net gains under steady state conditions?? biomass forest floor soil organic matter Jobbagy & Jackson 2003 – Biogeochemistry Laclau 2003 – Forest Ecology & Management Nosetto et al. 2006 – Journal of Arid Environments Piñeiro et al – unpublished data
C uptake (NPP) biomass forest floor soil organic matter
Berthrong et al. in preparation SOC differences in paired stands native grassland vs. eucalypt plantation ppt gradient (Argentina-Uruguay) (-) soil organic matter (=) 100% 50% Isotopic (13C) evidence points to lower inputs to SOC compared to grasslands (a) higher aerial vs. belowground inputs causing lower humification rates seem more important than (b) lower biomass quality (just small) or (c) higher SOC decomposition rates (not seen at all) 20% same -20% -40%
SOM - Kg C / m3 SOM - Kg C / m3 0 20 40 60 0 20 40 60 80 0 0 20 20 40 40 CASTELLI (50 years) GUERRERO (97 years) depth (cm) 60 60 grassland plantation 80 80 differences p<0.05 100 100 ∂13C ‰ ∂13C ‰ -16 -20 -24 -28 -32 -16 -20 -24 -28 0 0 depth (cm) (new C) (new C) 100 100
biomass (+) (?, but possibly ++) forest floor (-) soil organic matter
trade-off 1: water C uptake (NPP) biomass Declining water yields in small watersheds of increasing relative importance towards drier climates High groundwater consumption and localized salinization in flat sedimentary regions (Pampas) below ~1200 mm/yr of precipitation Jobbágy & Jackson 2004 Global Change Biology Jackson et al. 2005 – Science Farley et al. 2006 – Global Change Biology Nosetto et al. 2008 – Global Biogeochemical Cycles
8 1:1 line 7 pH tree plantation mean pH drop 6 5 4 4 5 6 7 8 pH grassland trade-off 2: calcium redistribution biomass forest floor soil organic matter Review of paired soil studies (plantation vs. grassland) High Ca demand, sequestration, and export leads to soil acidification. eucalypts >> pines wet & sandy/weathered contexts: stream acidification Jobbágy & Jackson 2003 – Biogoechemistry Jobbágy & Jackson - Ecology Berthrong et al. 2008 – Ecological Applications Farley et al. 2008 – Water Resources Research Piñeiro et al. unpublished data
Guess where our best C stock is
Para 12C dS/dt = I – k S(t) En nuestro caso, para tiempo = 0 (establecimiento) y para tiempo = X (edad al muestreo) conocemos S y S* Además conocemos rI (I*/I) Queremos averiguar I y k, y así proyectar S en otras tiempo/condiciones rI = rS Para 13C dS*/dt = I* – k S*(t) Solución 100% analítica, exacta, sin parámetros ajustables
Tiempo de renovación • mas rápido en superficie • Valores similares en ambos sitios • Descenso de I en profundidad • (en Guerrero 480, 219, 103, 42, 25 y 16 g/m3 por estrato) • I es menor en Guerrero • (monte de baja densidad sujeto a cosecha…) • Muy bajos Ingresos respecto • a los valores conocidos de producción • En 0-20, I = 450-900 Kg C/Ha/año • Productividad primaria neta aérea de aprox 5000 Kg C/Ha/año • Biomasa raíces (<0.5 cm diámetro) 4500 Kg. C/Ha/año Aplicación del modelo