Download
1 / 44
630 likes | 1.26k Vues
CMOS VLSI Design DC Transfer Characteristics and Switch –level RC delay Models. DC Response. DC Response: V out vs. V in for a gate Ex: Inverter When V in = 0 -> V out = V DD When V in = V DD -> V out = 0 In between, V out depends on transistor size and current

E N D
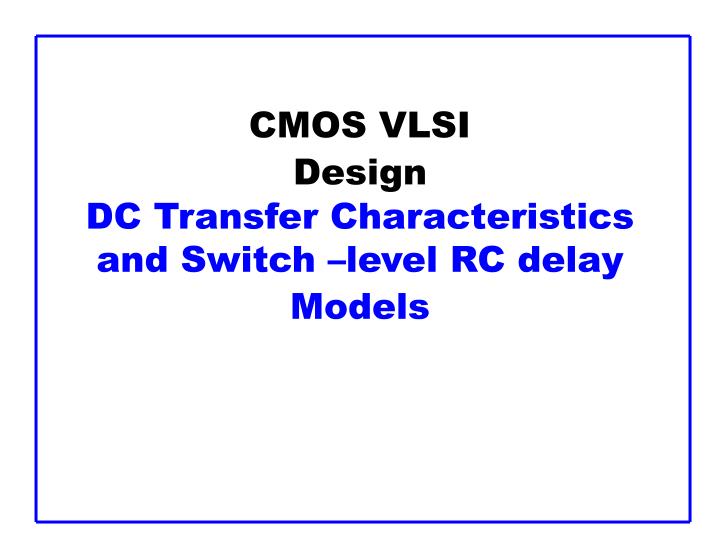
CMOS VLSIDesignDC Transfer Characteristics and Switch –level RC delay Models
DC Response • DC Response: Vout vs. Vin for a gate • Ex: Inverter • When Vin = 0 -> Vout = VDD • When Vin = VDD -> Vout = 0 • In between, Vout depends on transistor size and current • By KCL, must settle such that Idsn = |Idsp| • We could solve equations • But graphical solution gives more insight
Transistor Operation • Current depends on region of transistor behavior • For what Vin and Vout are nMOS and pMOS in • Cutoff? • Linear? • Saturation?
nMOS Operation Vgsn = Vin Vdsn = Vout
nMOS Operation Vgsn = Vin Vdsn = Vout
pMOS Operation Vgsp = Vin - VDD Vdsp = Vout - VDD Vtp < 0
pMOS Operation Vgsp = Vin - VDD Vdsp = Vout - VDD Vtp < 0
I-V Characteristics • Make pMOS is wider than nMOS such that bn = bp
Current vs. Vout, Vin plot absolute value of pMOS
Load Line Analysis • For a given Vin: • Plot Idsn, Idsp vs. Vout • Vout must be where |currents| are equal in
Load Line Analysis • Vin = 0
Load Line Analysis • Vin = 0.2VDD
Load Line Analysis • Vin = 0.4VDD
Load Line Analysis • Vin = 0.6VDD
Load Line Analysis • Vin = 0.8VDD
Load Line Analysis • Vin = VDD
DC Transfer Curve • Transcribe points onto Vin vs. Vout plot
Operating Regions • Revisit transistor operating regions
Operating Regions • Revisit transistor operating regions
Beta Ratio • If bp / bn 1, switching point will move from VDD/2 • If bp / bn< 1, the inverter is LO-skewed • If bp / bn> 1, the inverter is HI-skewed
Noise Margins • How much noise can a gate input see before it does not recognize the input? NMH= VOH-VIH NML = VIL - VOL
Logic Levels • To maximize noise margins, select logic levels at
Logic Levels • To maximize noise margins, select logic levels at • unity gain point of DC transfer characteristic
Pass Transistors • We have assumed source is grounded • What if source > 0? • e.g. pass transistor passing VDD
Pass Transistors • We have assumed source is grounded • What if source > 0? • e.g. pass transistor passing VDD • Vg = VDD • If Vs > VDD-Vt, Vgs < Vt • Hence transistor would turn itself off • nMOS pass transistors pull no higher than VDD-Vtn • Called a degraded “1” • Approach degraded value slowly (low Ids) • pMOS pass transistors pull no lower than Vtp
Tristate Inverter Why (d) is a bad design? If EN = 0, Y is supposed to be float, but if A changes, charge at internal node may disturb node Y. more in section 6.3.4)
Effective Resistance • Shockley models have limited value • Not accurate enough for modern transistors • Too complicated for much hand analysis • Simplification: treat transistor as resistor • Replace Ids(Vds, Vgs) with effective resistance R • Ids = Vds/R • R averaged across switching of digital gate • Too inaccurate to predict current at any given time • But good enough to predict RC delay
RC Delay Model • Use equivalent circuits for MOS transistors • Ideal switch + capacitance and ON resistance • Unit nMOS has resistance R, capacitance C • Unit pMOS has resistance 2R, capacitance C • Capacitance proportional to width • Resistance inversely proportional to width
A nMOS transistor of unit size: minimum length and minimum contacted diffusion width, size = 1 means that W = 4 , L = 2 , W/L = 2 A nMOS transistor size = k
Unit nMOS has resistance R, capacitance C • Unit pMOS has resistance 2R, capacitance C
RC Values • Capacitance • C = Cg = Cs = Cd = 2 fF/mm of gate width • Values similar across many processes • Resistance • R 6 KW/mm in 0.6um process • Improves with shorter channel lengths • Unit transistors • May refer to minimum contacted device (4/2 l) • Or maybe 1 mm wide device • Doesn’t matter as long as you are consistent
Inverter Delay Estimate • Estimate the delay of a fanout-of-1 inverter
Inverter Delay Estimate • Estimate the delay of a fanout-of-1 inverter
Inverter Delay Estimate • Estimate the delay of a fanout-of-1 inverter
Inverter Delay Estimate • Estimate the delay of a fanout-of-1 inverter d = 6RC