Download
1 / 91
930 likes | 1.11k Vues
S tudent M anaged F und. Investment Process Presentation. Arnone-Lerer Social Responsibility Fund Undergraduate Students. Business Cycle. Dan Urbanowicz Andrew Kolb. Business Cycle Analysis. Define Stages of the Business Cycle Identify Current Stage

E N D
Student Managed Fund Investment Process Presentation
Arnone-Lerer Social Responsibility Fund Undergraduate Students
Business Cycle • Dan Urbanowicz • Andrew Kolb
Business Cycle Analysis • Define Stages of the Business Cycle • Identify Current Stage • Identify Industries that Historically Perform Well • Monitor Economy for Change in Stage
Define Stages of Business Cycle • 5-Stage Overall Cycle • Stages Last 6-18 Months • Based Upon Various Govt. Economic Data • All Data Signals Transition; “Not Timing Market”
Five Stages of Business Cycle • Ease-Off • Slowing of Recovery • Plunge • Negative Growth • Revival 1 • Beginning of Recovery • Revival 2 • Solid Recovery • Accelerate • Growing Too Fast
Identify Current Stage (Stats.) • Money Supply • Consumer Price Index (CPI) • Producer Price Index (PPI) • Components of GDP • Unemployment Claims • Industrial Production • Non-Farm Payrolls • Weekly Hours Worked • Housing Starts
Where We Are… • Ease-Off: period where Fed is tightening to control inflationary pressures by slowing growth of economy • Traditional Indicators: • Industrial Production growth rate declines • Initial Unemployment Claims increase • Non-Farm Payrolls growth rate declines • Additional Indicators: • Weekly Hours Worked decline • Housing Starts decline • GDP Growth rate declines • PPI & CPI growth increasing slightly • Monetary Base growth rate declines
Biotechnology Tobacco Health Care Equip/ Supp Pharmaceuticals Airlines Food & Staples Retailing Software Commercial Banks Health Care Providers IT Services Electric Utilities Computer & Peripherals Aerospace & Defense Construction/Engineer Gas Utilities Ease-Off - Outperformers
Monitor Economy • Attend Weekly QInsight Conference Calls • Monitor Govt. Statistics for Change in Stage • Peak in Federal Funds Rate • Increase in Monetary Base • Bias of Fed from Tightening to Stimulating
Social Responsibility • Drew Robinson • Kristin DiFabio • Jen Ziomek
Value & Integrity Superior to Profit • Assimilation of intellectual and moral perspective in every area of academic study and life • As a University, continue the rich tradition of Catholic Social Teaching and the guidance it provides • Consideration for stakeholders and not just stockholders
Why Invest in Soc. Res. Company • To answer the question of whether social screening carries an inherent financial “cost” • Avoid investments in companies that we believe are detrimental to society • Reward companies for being leaders among their peers in the corporate world • Prove that a comparable return on investments can be achieved
Steps to Investing 1.) Evaluated the Catholic Bishop’s Statement 2.) Chose and ranked our criteria based on past evaluations and our own additions 3.) Ran IWFinancial for Social Responsibility rankings
Catholics Bishop’s Statement • Comprehensive set of policies • Faithful, competent and socially responsible stewardship • Draws the values, directions and criteria from: • Gospel • Universal church teaching • Conference statements
Security Analysis • Colin Darretta • Denis Craig
Security Selection • Securities with Strong Fundamentals • Securities with Managed Debt • Securities with Strong Valuation Characteristics • Two Separate Round of Analysis
Round 1 – Fundamental Analysis • Input Templates Created • Balance Sheets, Income Statements, Cash Flow Statements Scoured for Data • The data was then formulated and output into information that would indicate the fundamental strength or weakness of company
Fundamental Analysis • Securities were eliminated through Round 1 for various reasons: • P/E ratios that were considerably higher than industry averages • Low Bond Ratings • DuPont Ratios that demonstrated weakness • Negative Trends • Significantly below Industry Averages • Unhealthy Altman Z-Scores • Manufacturing – Below 1.81 • Non-Manufacturing – Below 1.10
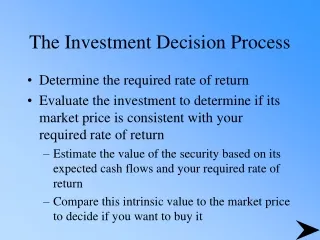
Round 2 – Security Valuation • The refined pool of securities was then further examined • Individual valuations were performed on each of the securities • We were looking for where value was derived from (operating vs. non-operating) • Present Value of Future Cash-Flows to the Firm • Book Value of Debt and Preferred Stock • Market Value of Equity – Per Share
Security Valuation • Over-Valued Securities eliminated based on: • Low Present Values of FCFF • Low Terminal Value of Firm (Discounted to PV) • Unusual Balance of Firm Value between operating and non-operating assets
Final Security Selection • The stocks that passed both rounds were then re-examined in comparison with one another and ranked • Securities made it into the portfolio process by demonstrating strong fundamentals and relatively undervalued pricing
PSMP Portfolio Analysis • Kristin DiFabio
PMSP Software • Portfolio Optimizer • Uses a Lower Partial Moment Heuristic to determine portfolio allocations • Used industry returns as a basis for analysis • Began with 50 companies • Used the Nawrocki LPM Heuristic to find a set of optimal portfolios
PMSP Software (cont.) • Once we selected our optimal portfolio, we determined which stock’s allocations were out of compliance with our investment guidelines • We adjusted these allocations through several iterations until coming up with our optimal portfolio
Summary • Investment Value $116,630 • Biotech 10.0% • Construction 5.0% • Finance 18.4% • Healthcare 24.9% • Restaurants 12.5% • Software 12.5% • Utilities 16.7%
Technical Analysis • Ryan Doyle
Goals • Action on current positions • Enhance entry and exit points • Appropriate profit targets and stop losses • Find significant technical changes to current holdings • Document and analyze past recommendations for accuracy to determine value of technical analysis
Group Structure • 6 analyst monitoring approximately 7-10 securities each • Spreadsheet includes data such as RSI, projected profit/loss targets, alerts, and recommended actions • PowerPoint presentation is designed to propose recommendations to changes in portfolio to be discussed and voted on in class
Methodology • Long term support and resistant trends • RSI analysis to determine if security is overbought or oversold • Chart moving averages • Project relevant profit targets and stop losses based on these trends • Recommend action based purely on chart • Report to class any charts of significance and vote on action after discussing fundamentals
Methodology (cont.) • Profit Target at 28.5 • RSI is still very high while ABI trades at the top of the channel • Example of recommendation to reduce holdings
Entry and Exit Sonic • Recommendation: Buy Comcast • Recommendation: Sell
Summary • Provide technical analysis of all current holdings and recommended securities • Provide an additional point of view for class discussion • Provide statistical performance report on recommendations based on technical analysis
Compliance • Chris Auffenberg
George Coleman Fund • 50% International Investment • Maximum initial investment in one country limited to 25% of total international investment • Rebalance investment to 25% when it reaches 30% • 50% Domestic Investment • Maximum initial investment limited per sector to 20% of total domestic investment • Rebalance investment back to 20% when it reaches 25%
Arnone-Lerer SRI Fund • Individual Securities • Maximum initial investment of 5% of total value • Rebalancing back to 5% when security reaches 7% • Industries • Maximum initial investment of 12.5% in companies in same industry • Rebalancing back to 12.5% when industry reaches 17.5% of total portfolio value
George Coleman Fund Graduate Students