Download
1 / 16
170 likes | 387 Vues
Soil Moisture and Temperature SM300. By Jinda Sae -Jung Updated: 27.06.2012 (O.F.). Soil Moisture Sensor Location. HAN. MT. EMB. Delta-T Devices Ltd - SM300 sensor installation.

E N D
Soil Moisture and Temperature SM300 By JindaSae-Jung Updated: 27.06.2012 (O.F.)
Soil Moisture Sensor Location HAN MT EMB
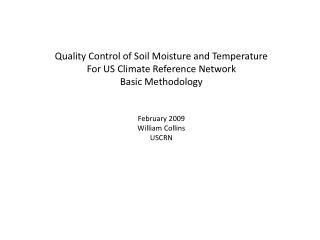
Delta-T Devices Ltd - SM300 sensor installation • The SM300 sensor has two sensing rods which can insert directly into soil to measure soil moisture and temperature (Figure 1a). • A delta-T GP1 data logger is used to connect with SM300 to collect the data (Figure 1b). • There are 6 different wires from the sensor which each of them connects into different channel on the data logger (Figure 1c). • Then install SM300 sensors into the soil. It is required to cover the sensor under the soil at least 5 cm for measuring near surface soil temperature. • Install DeltaLINK logger software into the computer to configure the correct channel for soil moisture. • Use the connecting cable to connect the data logger to computer to obtain data.
Delta-T Devices Ltd - SM300 sensor • The collecting data are measured in voltage and it is converted into % volume using a direct conversion for mineral and organic soils as follow, where V is from SM300 output in voltage values. • A 9 volt battery inside the data logger is required to change when the power is lower than 6.6 volt.
Sensor installation (c) (a) (d) (b) Figure 1 (a) a SM300 sensor (b) a data logger (c) logger cables to connect the logger and a sensor (d) insert the sensor into soil
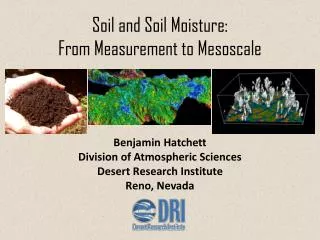
Embankment garden (EMB) Figure 2 (a) two sensors were installed under the grass at 5 and 11 cm depths (b-d) a GP1 data logger was covered at the corner of the flower plant far from the sensors 1 m.
Hanover square (HAN) Figure 3 (a) two sensors were installed under the grass at 5 and 11 cm depths (b-d) a GP1 data logger was covered under the soil far from the sensors 1 m.
Middle Temple (MT) Figure 4 Top: sensors at 20 and 30 cm depths , bottom: sensors at 5 and 12 cm depths
Copy the data from the data logger and Save the data in as .dt6 (LLL_DDMMYY_SSS.dt6) Serial number of the sensors location
Soil Moisture and Temperature- Plotting data from the SM3000 • When at soil logger sites, use DeltaLink to save the data as files in .txt, .csv and the Delta Link format- .Dl6 • Copy all files across from the laptop/ tablet pc into “Data02 DataStore/ data/London/2012/Raw/ SiteName/” • Save in relevant format folder and in “raw” folder • Open the .txt file USING TEXTPAD – Do not use Excel because formatting the timestamp in Excel simplifies it to “short/ long date format” removes HH:MM:SS information. • Search the .csv format file for inconsistencies with the data format in Copy the data from the .csv file just collected into the appropriate annual file for the site- check that timestamps in both are consistent before adding new data
Scripts for PLOTTING are found in: • “Data02Datastore :\data\2012\London\raw\NEW CODE” is the directory for the soil moisture scripts. • Plot of Individual Data loggers’ Moisture and Temperature: • Open SM_V3.R • Check that “folder” object points to the directory for the data file collected • Check that “File” is named for the file you want to read in and plot soil moisture and temperature from • Change “PLACE” to the correct number for the logger site you want plotted (look at script for what each number means – important since the type of soil causes soil moisture equations to vary for sites
Script Errors –Troubleshooting • Run SM_V3.R • Any errors when running this may be caused by the files that Delta Link has saved. • Check that the columns in SM_V3.R do correspond with temperature and moisture in the files. • Check that directory names are correct.
Annual Data plot: • Copy the directory of annual data into “SM_Annual.R” and then open R and run the file. • If the program is targeting the correct directory, it should create a plot of all the data in “Annual 2012.txt”.
Soil moisture and temperature processing connect Data logger (EMB/HAN/MT) computer ( open the DeltaLink program). Save the data as .dt6 (LLL_DDMMYY_SSS.dt6). AND as .CSV (LLL_DDMMYY_SSS.CSV). Copy to ‘micrometDatastore’ “X:\data\2012\London\raw\ ” and save as .txt, .csv and .dt6 in respective folders for formats. * The codes for soil moisture are in ‘micromet’ Z:\data\2011\London\raw\Soil_moisture _code Run SM_v3.R from folder: MicrometDataStore_Data02:\local_files. Make sure it loads .CSV. This converts variable to % soil moisture. It plots a graph for the input data. User must define site number and check folder name (drive letter) is correct. Save Profile Images in X:\data\YEAR\London\L0\ ‘SITE NAME’\Profiles
Adding data to Annual plot • Use “SM_Annual.R” script in: W:\data\2012\London\raw\NEW CODE • It requires you to add new data to .txt/.xls files in: W:\data\2012\London\raw\Annual Files • This script will be used to create a graph of all data in the Annual files ( you must manually check that all dates for the year are copied into the files). Use annual plots to check data is realistic and fairly consistent between loggers at different sites.
Collecting the data -> JindaSae-Jung or Paul Smith • Programming -> JindaSae-Jung or CrisCatillo