Download
1 / 43
450 likes | 643 Vues
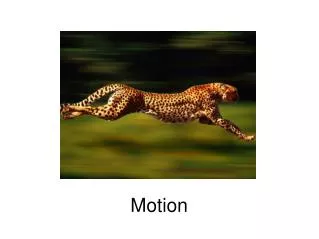
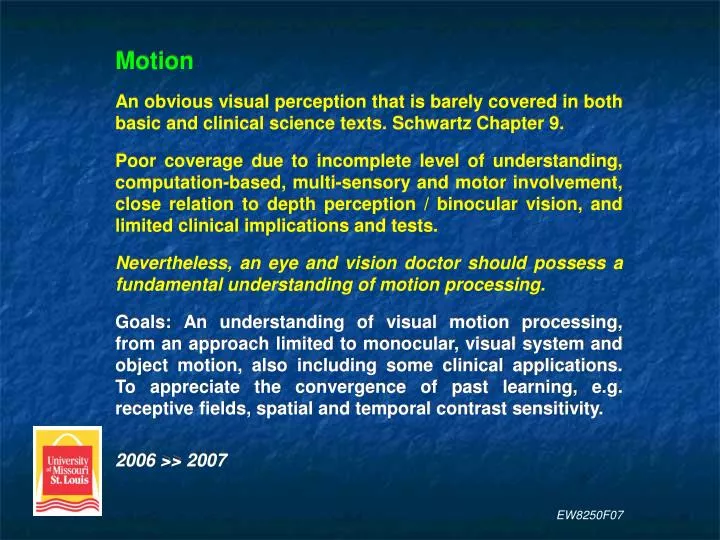
Motion An obvious visual perception that is barely covered in both basic and clinical science texts. Schwartz Chapter 9.

E N D
Motion An obvious visual perception that is barely covered in both basic and clinical science texts. Schwartz Chapter 9. Poor coverage due to incomplete level of understanding, computation-based, multi-sensory and motor involvement, close relation to depth perception / binocular vision, and limited clinical implications and tests. Nevertheless, an eye and vision doctor should possess a fundamental understanding of motion processing. Goals: An understanding of visual motion processing, from an approach limited to monocular, visual system and object motion, also including some clinical applications. To appreciate the convergence of past learning, e.g. receptive fields, spatial and temporal contrast sensitivity. 2006 >> 2007 EW8250F07
Motion Physical (object space) motion is defined as: ∆ position / ∆ time = TF / SF where TF = Temporal Frequency, SF = Spatial Frequency, Hz = cycles/second = c/sec, c/deg = cycles/degree. and TF / SF = (c/sec) / (c/deg) = deg/sec = °/s °/s = speed °/s in a particular direction = velocity Visual system neurons are tuned to velocity. EW8250F07
Yes, color (parvo-neurons) does input. Motion The motion pathway extends from the retina to the dorsal cortex (temporal lobe). Coding of local motion occurs in the retina and involves parvo- and magnocellular ganglion cells. Coding of complex and global motion occurs in cortical areas V1 (level 4B), V2, V3 and MT and MST (middle and middle-superior temporal). EW8250F07
Motion Parvocellular and magnocellular pathways / information combine. Ref-8 EW8250F07
Motion Parvocellular and magnocellular pathways / information combine. To MT yes for both pathways EW8250F07
Motion Dendritic field size (m) Magnocellular Parvocellular (mm*3.3 = degrees) Ref-1 Parvocellular Neurons Midget ganglion cells, sustained response, small dendritic field. Encodes slow velocity, high spatial frequency (small RF), color. Low contrast gain. ~70% of all ganglion cells. Magnocellular Neurons Parasol ganglion cells, fast/burst response, large dendritic field. Encodes fast velocity, low spatial frequency (large RF), luminance. High contrast gain. EW8250F07
Contrast Gain, i.e.response to increasing contrast: magnocellular neurons > parvocellular neurons. Implications for operating range of motion (and spatial) vision. Ref-1 EW8250F07
Expansion of dendritic fields with retinal eccentricity, along with increased separation of ganglion cells, explains the reduction in spatial acuity with retinal eccentricity. In contrast, the prevalence of midget and parasol ganglion cells throughout the retina explains the overallconsistent range of motion ability with retinal eccentricity. Spatial acuity Ref-6 Dendritic fields Ganglion cell proportions EW8250F07
Filled symbols = parvocellular post lesion of magnocellular Open symbols = magnocellular post lesion of parvocellular Motion = ∆ position / ∆ time = TF / SF = º/s with direction The visual system encodes the most salient motion information. Thus contrast of motion information is very relevant – the temporal and spatial contrast sensitivity functions. Ref-1 Ref-1 EW8250F07
Motion = ∆ position / ∆ time = TF / SF = º/s with direction Spatiotemporal CSF peak sensitivities: Intermediate spatial frequencies (~6 c/deg) with low temporal frequencies (~1 Hz), i.e. peaks of parvocellular T-CSF and S-CSF Intermediate temporal frequencies(~10 Hz) with low spatial frequencies (~1 c/deg), i.e peaks of magnocellular T-CSF and S-CSF Filled symbols = parvocellular Open symbols = magnocellular Ref-1 Ref-1 EW8250F07
Motion Parvo- and magnocellular pathways / information do mix. However, separate application is useful for understanding early motion encoding and certain pathologies & disorders. EW8250F07
The perception of motion is a visual inference. The two-dimensional images (x, y) encoded by the retina are used by the visual system to create the perception of objects moving in three dimensions (x, y and z (time)). This complexity has contributed to the limited understanding of motion. Examples that motion is a visual inference: Apparent Motion, e.g. marquee lights flashing in sequence appear to be moving although each light is fixed in place. Motion Aftereffects, e.g. the waterfall illusion: after staring at a waterfall the adjacent land will appear to be moving upwards at a velocity equal to the downward water. Irrelevant feature effects, e.g. color and contrast (both not relevant to the physical motion definition (deg / sec)) can be adjusted to make moving targets appear to be stationary. That 1 – 3 shows the visual system is fooled with regard to motion is strong evidence for the inference, or neural computation, of motion. EW8250F07
Target in object space moving upwards. Non-continuous sampling of the retinal image motion. Motion is computed. Continuous sampling of the retinal image motion. Motion: Space-Time Diagram The visual system samples the continuous motion of an object. If the sampling rate of the retinal images is adequate the visual system computes object motion. A space-time diagram is used to conceptualize this sampling. Ref-2 EW8250F07
Flatter slope or more oblique orientation = higher velocity Motion: Space-Time Diagram Preserves retinal image information: x and y (spatial) dimensions on one axis, and t (temporal) dimension on the other axis. Also represents the velocity of the retinal image (slope). Ref-3 EW8250F07
Motion: Space-Time Diagram Per legend: Two ways of thinking about a moving image. Adopt one. Option A is based on vectors (speed magnitude and direction). Option B is based on retinal contrast, thus conceptually simpler. Ref-3 EW8250F07
The human visual system is capable of a large range of object velocities. Motion: Space-Time Diagram Limits to perception of continuous motion: object velocity. Ref-2 Ref-2 Motion perception threshold, i.e. the slowest motion perceptible, is ~1’ / sec. EW8250F07
Continuous sampling rate. Visual system does not do this. Non-continuous sampling rates. Must be adequate to enable motion computation. Sampling rate limits are set by neuron motion detectors located in the retina through higher-order visual cortex. Motion: Space-Time Diagram Limits to perception of object velocity: sampling rate. Ref-1 EW8250F07
Perception for any line movement direction is the same: perpendicular to the line orientation. time 2 time 1 time 2 time 1 time 2 time1 Motion: the Aperture Problem There is a local (small scale) ambiguity in encoding of retinal image motion (speed and direction) due to neuron sampling of object motion through its small receptive field (an aperture). EW8250F07
Motion: the Aperture Problem Conceptualize this from the view of the neuron receptive field or your view through an aperture. Perception for any direction of line movement is the same: perpendicular to the line orientation. What relieves this ambiguity is seeing the correspondence of points along the moving line, e.g. a bend or break in the line. This allows computation of the speed and direction of motion. What if these corresponding points are not available? Ref-2 EW8250F07
Solution of the aperture problem requires higher-order processing of local motion information, involving neurons with large receptive fields and tuning to patterns and forms. The Aperture Problem A possible solution Ref-2 Ref-2 The diamond moves rightward but many single neurons signal local non-rightward motion. Common vector computation of the single neuron signals, i.e. intersection of their constraint lines, allows perception of the proper motion direction. EW8250F07
Motion: the Aperture Problem Visual system solution confirmed by studies using plaid stimuli (D). Neurons found in MT that strongly respond to the common vector of two superimposed sinewaves (i.e. the intersection of the constraint lines), much more than to the component vectors. The plaid result holds strongest for sinewaves of the same contrast and spatial frequency. Thus the visual system judiciously combines motion information. Ref-3 EW8250F07
Motion: the Aperture Problem Visual system solution confirmed by studies using plaid stimuli (D). The plaid result holds strongest for sinewaves of the same contrast and spatial frequency. The visual system judiciously combines motion information. If the contrast and/or spatial frequency of the two sinewaves were very different then the vector calculation would not yield what is pictured and the MT neuron would not respond or respond much less. EW8250F07
Motion: the Aperture Problem Visual system solution confirmed by studies using plaid stimuli (D). Similar evidence found using global motion from random dot stimuli. Ref-9 EW8250F07
Higher-order neuron properties are built on the properties of early visual processing, e.g. the spatial and temporal CSF. Ref-3 Ref-1 Intermediate spatial frequencies (~6 c/deg) with low temporal frequencies (~1 Hz), i.e. peaks of parvocellular T-CSF and S-CSF Intermediate temporal frequencies(~10 Hz) with low spatial frequencies (~1 c/deg), i.e peaks of magnocellular T-CSF and S-CSF EW8250F07
Solution of the aperture problem, and even larger ‘local’ motion signals, require higher-order processing of local motion information, involving neurons with large receptive fields and tuning to patterns and forms. Should add retinal motion detectors as the first level of the motion path. Opponent neurons for motion direction exist. Similar to color opponent neurons. V2 encodes motion properties that are very different than V1. And V3 versus V2, etc. Encoding of global motion occurs in MT. Ref-3 EW8250F07
Motion: Physiology and Models The Reichardt detector. Physiologically found in fly and insect retinas. Theoretically, and logically, exists in primate retina as the first step in motion processing. Many variants (e.g. lower model) but they are all essentially ‘delay-and-compare’ schemes. For the top model: a rightward moving bar would elicit neuron 1 spiking, this signal is delayed by an interneuron, the bar then elicits neuron 2 spiking, and both neuron signals simultaneously arrive at the summing neuron. Thus a leftward moving bar would not produce simultaneous arrival of the two signals. Neither would a bar moving at too fast or too slow velocity. Ref-2 EW8250F07
Motion: Physiology and Models The critical component of the Reichardt detector is the delay of one neuron signal (spike train) by an interneuron. All variant schemes contain dual neurons and a delay or modification (suppression or facilitation) of the signal from one neuron, dependent on whether the object has stimulated the neurons in their preferred direction. Ref-4 EW8250F07
The Reichardt Detector(A) Without an interneuron the encoding of direction of motion is not possible.(B & C) In the retina the time delay would be contributed by a small field amacrine cell (the interneuron) and result in the simultaneous arrival of signals from two bipolar cells at a ganglion cell.(D) More complex detectors are likely found in the cortex rather than the retina. Ref-9 EW8250F07
The Reichardt detector is combined with space-time diagrams to understand cortical neuron receptive fields tuning to motion. A stimulus must match a neuron sensitivity in space and time to produce a response. This is easily shown by plotting both on a space-time diagram. Ref-2 Ref-1 EW8250F07
The Reichardt detector is combined with space-time diagrams to understand cortical neuron receptive fields tuning to motion. A stimulus must match a neuron sensitivity in space and time to produce a response. Easily seen plotting both on a space-time diagram. Ref-1 Ref-2 EW8250F07
Motion: Cortical Neuron Tuning (V1 and V2) Motion processing is greatly expanded beginning in area V1. When tested with their optimal sine wave spatial frequency, the majority of neurons demonstrate tuning for direction and speed, i.e. they are motion sensitive. Additionally, neurons respond minimally when their optimal sinewave moves opposite to the preferred direction. Receptive fields generally remain small so local motion is predominantly processed. Processing occurs at each point beyond the first synapse (cortex entry), e.g. within layers 4C and 4C, layer 4B, area V2, V3 etc. That is, no simple relaying of information occurs. EW8250F07
Motion: Cortical Neuron Tuning (area MT, or V5) Not large relative to earlier visual areas because receptive fields are very large and it is the most homogenous visual area with respect to function. EW8250F07
Motion: Cortical Neuron Tuning (area MT, or V5) Area MT and MST integrates the local motion information from V1 and V2 to compute the presence of global motion. Physiological evidence for neurons responsive to plaids (‘pattern cell’) more than the component sinewave motion. Also, neurons responsive to coherent motion more than the local (dot) component motion. Coherent motion also called second-order motion in some texts, e.g. Schwartz. Ref-5 EW8250F07
Response rate (spikes) Velocities Direction Sensitivity range: 2–200 /s. Most neurons prefer: avg 30 /s Motion: Cortical Neuron Tuning (area MT, or V5) Narrow direction tuning, independent of velocity. Promotes efficiency – less neurons to encode all velocities. Indirectly this suggests multiple interneurons, i.e. delay neurons, or likely more complex motion detectors. Ref-4 EW8250F07
Motion: Cortical Neuron Tuning (area MT, or V5) Receptive fields are much larger than V1 and V2, thus predominant processing of global, pattern and coherent object motion. RF size (deg)* RF scatter (deg) [disregard] Ref-4 EW8250F07
Motion: Cortical Neuron Tuning (area MT, or V5) Lesion studies in primates confirm motion processing. Cases of motion-blindness, or akinetopsia, exists in humans. The world is a series of still images, like perceptions when viewing under stroboscopic lighting. Microstimulation studies confirm direction tuning and effects on primate motion discrimination performance, i.e. the motion cell responses can be altered to improve or weaken perception. Regardless of the site of cortical deficit, reduced global motion (structure from motion) is typically found, rather than reduced local motion (direction discrimination). Coincident reduction in three dimensional perception and/or visual field deficit is often found in humans with MT damage. EW8250F07
MT motion deficits are mimicked by damage to other areas, e.g. inferior parietal lobe, middle cerebellum and occipito- temporal regions. This reflects the output of information from MT to other multi-sensory and cognitive brain centers. FEF frontal eye fields FST fundus of superior temporal sulcus MST middle superior temporal VIP ventral intraparietal Ref-7 EW8250F07
Motion Clinical conditions include stroke, head injury, glaucoma and conditions significantly affecting neurons of the motion pathway (i.e. parvocellular, magnocellular and mixed). Cases of intact form and color without motion perception. Range of velocity used in human psychophysical studies: 0.25 – 256 deg/sec. Slow velocity: < 4 deg/sec. Midrange velocity: 5 – 50 deg/sec. Saccadic velocity: 256 deg/sec. MT cells mimic psychophysics: 2–200, avg 30 deg/sec. Human discrimination of velocity, i.e. the smallest just noticeable difference between two moving targets, is best at 4–16 deg/sec. Further, optimum velocity discrimination and perceived velocity is as good in the periphery as in the fovea, if target size is scaled up in the periphery. EW8250F07
Dynamic AcuityAcuity is constant and good while tracking a moving target until about 60 – 80 deg/sec. This is about the limit of accurate pursuit movements so acuity dramatically decreases at higher velocities. Ref-5 EW8250F07
Motion Clinical assessment requires computer-based stimuli. Random-dot kinematograms (RDK) are best because of minimal motion cues from changes in stimulus position. They naturally assess global more than local motion and the discrimination task can produce three thresholds: Coherence = minimum percentage for motion perception Dmin = minimum dot displacement for motion perception Dmax = maximum dot displacement for coherent motion Dmin values typically 10–30 seconds of arc. Dmax values typically 30–60 minutes of arc. Ref-5 EW8250F07
Percent dot coherence (motion) is used for both the minimum maximum amount of displacement that produces the perception of global, or second-order, motion. Normal Dmin values are typically 10–30 seconds of arc. Normal Dmax values are typically 30–60 minutes of arc. Both measures vary with dot size and amount, target field size, etc. Further, the range of normal values are small relative to the increments of the Dmin and Dmax measures. Thus within-patient comparisons are preferred over between-patient comparisons for these measures. Ref-5 EW8250F07
References Wandell, B. (1995). Foundations of vision. Sinauer Associates, MA. Palmer, S. (1999). Vision science – photons to phenomenology. MIT Press, MA. Bruce, V., Green, P., & Georgeson, M. (2003). Visual perception: physiology, psychology and ecology. 4th Ed. Psychology Press, NY. Smith, A., & Snowdon, R. (1994). Visual detection of motion. Academic Press, CA. Schwartz, S. (2004). Visual perception – a clinical orientation. McGraw-Hill, NY. Rodieck, R. (1998). The first steps in seeing. Sinauer Associates, MA. Chalupa, L., & Werner, J. (Eds.) (2004). The visual neurosciences. MIT Press, MA. Kaufman, P., & Alm, A. (Eds.). 2003. Adler’s Physiology of the Eye, 10th Ed. Mosby. Snowden, R., Thompson, P., & Troascianko, T. (2006). Basic vision: an introduction to visual perception. Oxford University Press, NY. EW8250F07
Supplement for Motion section Neuron RF size increase dramatically with higher-level visual areas. Larger RF reflects functionality, e.g. global motion & form perception. Higher-level areas influence lower areas via feedback connections. LGN & cortical feed-back connections >> feed-forward connections. Angelucci et al, 2003 EW8250F07