Download
1 / 19
190 likes | 273 Vues
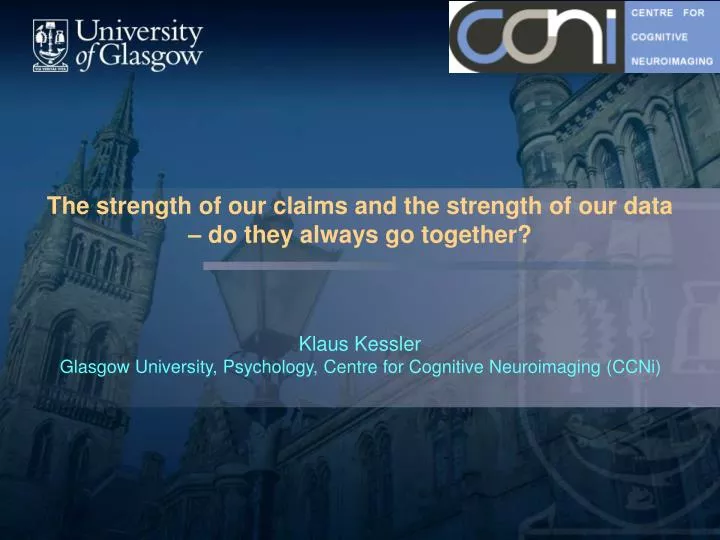
The strength of our claims and the strength of our data – do they always go together?. Klaus Kessler Glasgow University, Psychology, Centre for Cognitive Neuroimaging (CCNi). Society. Research community. Government/ Funding Bodies , etc. FUNDING. POLICIES. Media/Public Opinion.

E N D
The strength of our claims and the strength of our data – do they always go together? Klaus KesslerGlasgow University, Psychology, Centre for Cognitive Neuroimaging (CCNi)
Society Research community Government/ Funding Bodies, etc. FUNDING POLICIES Media/Public Opinion PeerReview/Debates Law Business/Entertainment/Advertisement IMPACT Neuroimaging Research and Society Schools of thought/ Paradigms (T. Kuhn) Methods: -fMRI/MRI -MEG/EEG etc. Publications/Conferences Analysis
Re-examining (long) published resultsin the light of new evidence • Kriegeskorte et al. (2009) Nature Neuroscience:“Circular analysis in systems neuroscience: the dangers of double dipping”= When a preliminary analysis is used to pre-select data (e.g. voxels in the brain) for subsequent statistics circularity between hypotheses/assumption and results. “Circularity is therefore the error that beautifies results, rendering them more attractive to authors, reviewers and editors, and thus more competitive for publication. These implicit incentives may create a preference for circular practices so long as the community condones them.” (p. 536)
Re-examining (long) published results • Sirotin and Das (2009) Nature:“Anticipatory haemodynamic signals in sensory cortex not predicted by local neuronal activity” = BOLD modulations in the absence of a stimulus Debate hosted by CCNi (http://www.ccni.gla.ac.uk/):“Does BOLD fMRI reveal Pseudo Neuronal Activity?”
Re-examining (long) published results • Yuval-Greenberg et al. (2008) Neuron:“… Gamma-Band Response in EEG as a Manifestation of Miniature Saccades”= some papers might have reported eye muscle effects and not brain effects
Cortex Neuron 4D Neuroimaging 248 channel MEG Three 64 electrode system EEG/MEG
2 sec, occipital Sensors Spontaneous brain activity
Slower rate = lower frequency: Theta oscillations (5 – 8 Hz) Brain rhythms/oscillations/frequencies • Fastest rate = high frequency: Gamma oscillation (30 – 80 Hz) • Fast rate = medium frequency: Beta oscillation (12 – 30 Hz) • Slower rate = lower frequency: Alpha oscillation (8 – 12 Hz)
Colour = Power (Strength) Frequency Time Time-Frequency
Re-examining (long) published results Yuval-Greenberg et al., 2008, Neuron:“… Gamma-Band Response in EEG as a Manifestation of Miniature Saccades” Recommendation: MEG and/or Eye-tracking for control
“Body Gestalt” No “Body Gestalt” (Body) Gestalt integration:Theta & Alpha
“Body Gestalt” No “Body Gestalt” (Body) Gestalt integration:Gamma
Kessler et al., 2006 Cortical Networks of Imitation: Power, Coherence & Synchronization
Oscillations reflect motor imagination online Motor imagination (as well as observation) suppresses alpha oscillations. Collaboration with Dr. Aleksandra Vuckovic (Clinical Rehabilitation Engineering, CRE) on Brain-Computer Interface with spinal cord injured patients.
So? • Self-regulation in the scientific process is sometimes delayed some neuroimaging results have to be re-examined in the light of new evidence or new methodological developments = solutions are available but at a delay. • Each Methodology (e.g. fMRI, MEG) has its own limitations in space or in time – we always look only at one side of the coin… • The strength of our claims does not always fit the strength of our data: • For the methodological reasons listed above • Because of ‘Impact’, i.e., stronger claims = more influence on public opinion/society = more funding. Regulatory process of society onto science
Thank you! Collaborator: Dr Sebastien Miellet
Constant phase-differenceover time Constant phase-differenceover trials SYNCHRONISATION IN THE NETWORK
Frequency components(time-frequency representations) Lokalisation with DICS(Kessler al., 2006) Averaging: phase locked responses ERFsBiermann-Ruben et al. (in press) MEG analysis