Download
1 / 11
110 likes | 291 Vues
WOSAT- 7-10 Earth Science Maps. Eric M. Sullenberger. Overview: Demographics. Russia Local School, Russia, OH- rural, public 8 th grade general science class 2 periods of 20 students each mixed ability. Overview: Unit. 8 th grade ESS- Earth Sys.

E N D
WOSAT- 7-10 Earth ScienceMaps Eric M. Sullenberger
Overview: Demographics • Russia Local School, Russia, OH- rural, public • 8th grade general science class • 2 periods of 20 students each • mixed ability
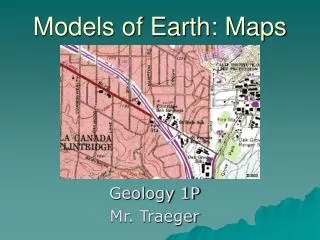
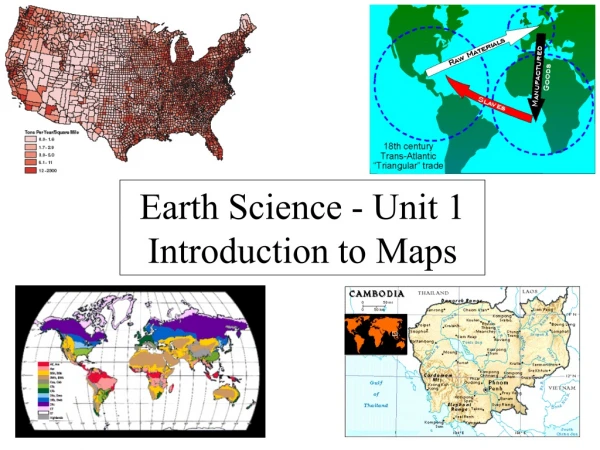
Overview: Unit • 8th grade ESS- Earth Sys. • Indicator: 11. Use models to analyze the size and shape of Earth, its surface and its interior (e.g., globes, topographic maps, satellite images). • Unit on Maps • Types • Terminology • Topography with 4 lab activities • Introduction to satellite technology
Overview: Topography Labs • Contour Lines and Using Topographic Maps • Simple label lines and turn into cross-section • Drawing Contour Maps • Elevations given, draw in contour lines • Making Contour Maps • Make model landscape out of clay, then draw map, then have another group reconstruct • Bathymetry and Sea-floor Sounding • Landscape made in box and then sounded with dowel rods to construct map.
Assessment: Informal • Open-inquiry Introductory Activity • What is a map?- students responded to this question and then looked at a plethora of different types of maps and then responded to this question again. Responses were graded looking to see a conceptual change. • Using contour lines- checked progress throughout the lab and then checked contour profile • Making Contour Maps & Bathymetry- collected final maps and monitored student participation.
Assessment: Formal • Drawing Contour Maps- students were required to complete and turn in at least two maps and attempt a third; bonus was given for completing all four maps. • Unit test & OAT review homework- the test checked each student individually and the OAT review checked their recall 2-3 weeks later.
Data Interpretation • The overall concept of maps was taught to students and overall they changed their views of what maps were. • Students gained knowledge of what contour maps are and learned how to read and even make them. • Because of the amount of lab work done a few students failed to comprehend the subject fully, as evidenced by some low test scores. • Retention however was high as most students still recalled the process weeks later.
Overall Reflection • Overall the unit went well. • The Intro to Maps will probably be shortened in the future by limiting the amount of time at each station and map, as well as limiting the writing involved. • Notes to review or going over the “Contour Lines” introduction lab will help check wayward progress early and save time overall. • Assign “Drawing Contour Maps” worksheets as homework, again to save time. • Find some way to store models between lab days. • Good unit, but took more time than was necessary.