Download
1 / 18
180 likes | 275 Vues
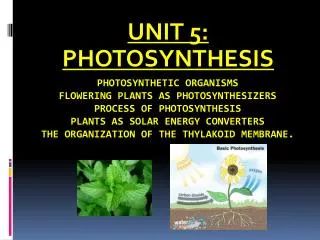
Unit 9. Photosynthesis. Introduction. Plants utilize the sun energy in a process called photosynthesis. The chloroplasts in the plant leaves harness that light and convert it into chemical energy.

E N D
Introduction • Plants utilize the sun energy in a process called photosynthesis. • The chloroplasts in the plant leaves harness that light and convert it into chemical energy. • Plants are called autotrophs because they use sunlight energy directly and combine inorganic compounds to form organic molecules. • Heterotrophs, on the other hand, obtain their energy by consuming other life forms. Humans are an example of heterotrophs. Balanced equation for photosynthesis 6 CO2 + 12 H2O + light energy C6H12O6 + 6 O2 + 6 H2O carbon water (sun) glucose oxygen water dioxide
Visible light spectrum wavelengths
How to use Spectronic 200 • http://www.youtube.com/watch?feature=player_embedded&v=MkUGz6kEQMg
Absorption spectrum of pigments using the spectrophotometer • A spectrophotometer can be used to measure absorption and transmittance of light through solutions. • Go back to the chapter of spectrophotometry to understand the use of the blank (B) • Experiment • Carotene (C) and spinach (S) extracts will be tested regarding their absorption and transmittance at different wavelengths. C B S
Carrot extract transmittance readings WL= wavelength %T = transmittance Carrot extract WL %T WL %T
Spinach extract transmittance readings Spinach extract WL %T WL %T
Transmittance Graph Transmittance (%) Wave length (nm) If you invert this graph, you will see the classic absorbance graph found in your text book.
Inverted graph Absorbance Carotene Spinach 400 500 625 675 WL (nm)
Absorbance readings • The same procedure was done, but reading the absorbance of both spinach and carrot extracts. • The data was used to draw the graph shown in the next slide.
Absorbance graph absorbance Wavelength (nm)
Chromatography • Is used to separate substances from one another based on their characteristics. • This exercise will separate pigments of a spinach leaf. • The separation is due to the solubility of the pigment in the chromatography solvent (10% acetone in petroleum ether) and the affinity of the pigment to the paper surface. solvent Roll of chromatography paper
Experiment Adding pigment to the paper • On a 3 cm x 20 cm strip of chromatography paper, a baseline is drawn with pencil (graphite) about 2 cm from the bottom. On this pencil line the spinach leaf pigment is deposited by rolling a coin over the leaf, onto the paper. Paper strip Graphite line
Place the strip into the chamber. • The paper with pigment is placed into a test tube containing 1 cm of chromatography solvent. • Left undisturbed for 10-15 minutes the solvent moves up the paper and carries with it the pigments of the spinach leaf. The pigments move at their own characteristic rate. Solvent movement solvent
Results • There are four pigments that are seen on the chromatogram. • Carotene (orange) • Xanthophyll (yellow) • Chlorophyll a (blue-green) • Chlorophyll b (yellow-green) • Which pigment has the greatest affinity for the solvent? • Which has the greatest affinity for the paper? carotene Chlorophyll b Baseline
Rf ratio • Determine the Rf (ratio factor) value of each pigment. • To determine the Rf value of a pigment you must measure the distance traveled by the pigment/distance traveled by the solvent. • To determine distance traveled by the pigment you must measure from the middle of the pigment band to the baseline. • To determine the distance traveled by the solvent you must measure from the solvent line to the baseline. Solvent line baseline
Starch Localization • This experiment proves that the most common form of carbohydrate stored by plants is starch, a polymer of glucose. • To test for starch, the leaf pigments must first be removed by placing it in boiling 95% ethanol. Ethanol cannot be boiled directly on the hotplate. A beaker containing ethanol is placed into a larger beaker of boiling water Coleus sp.
Iodine is then added to the leaf. If starch is present the area will become blue-black . Before boiling After boiling and staining The End