Download
1 / 21
210 likes | 299 Vues
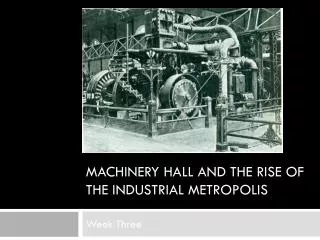
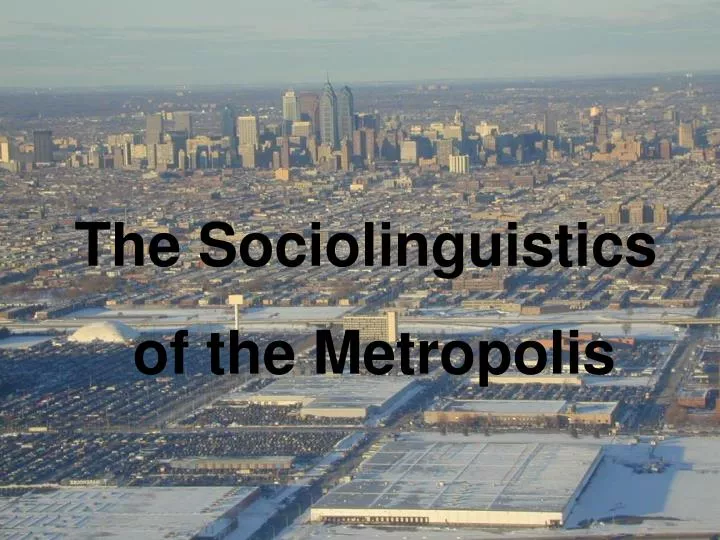
The Sociolinguistics of the Metropolis.

E N D
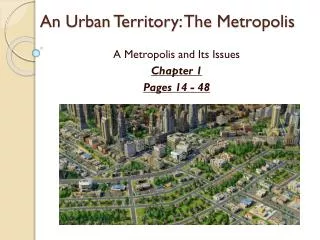
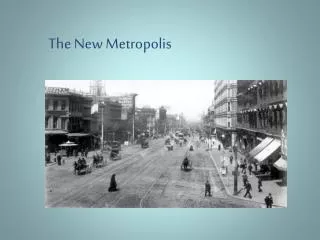
The Sociolinguistics of the Metropolis
It is a well-known fact that small cities are friendlier than big ones. But are they? Our research on street life indicates that, if anything, the reverse is more likely to be the case. As far as interaction between people is concerned, there is markedly more of it in big cities--not just in absolute numbers but as a proportion of the total. In small cities, by contrast, you see fewer interchanges, fewer prolonged goodbyes, fewer street conferences, fewer 100% conversations. . . Individually, the friendliness quotient of the smaller might be much higher. It could also be argued that friendships run deeper in a smaller city than in a larger one. As far as frequency of interchange is concenrned, however,the streets of the big city are notably more sociable than those of a smaller one. --William H. Whyte, City. NY: Doubleday, 1988, p. 6.
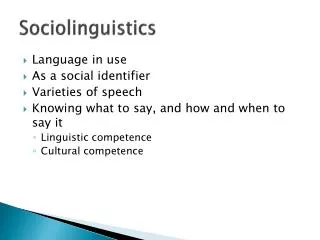
The speech community as • chaos “one cannot predict what a person will say” • a fictional construct “the reality is the individual speaker” • an average value “merely the average of individual idiolects”
Ten methods for gathering linguistic data in the metropolis Approach to Demogr. Volume Sound Control of Vernacular inform’n of speech quality variables Sociolinguistic interview Variable Excellent Excellent Excellent Variable Group sessions Excellent Variable Variable Fair Poor Participant observation Excellent Excellent Excellent NoneNone Site studies Good Poor Variable PoorNone Rapid & anonymous surveys Poor Poor PoorNone Excellent Written texts PoorVariable VariableNoneNone Studies of mass media PoorPoorVariable Excellent None Laboratory experiments Poor Excellent Variable Excellent Excellent Direct elicitation Poor Excellent Fair Excellent Excellent Introspection Poor Excellent None None Excellent
Ten methods for gathering linguistic data in the metropolis Approach to Demogr. Volume Sound Control of Vernacular inform’n of speech quality variables Sociolinguistic interview Variable Excellent Excellent Excellent Variable Group sessions Excellent Variable Variable Fair Poor Participant observation Excellent Excellent Excellent NoneNone Site studies Good Poor Variable PoorNone Rapid & anonymous surveys Poor Poor PoorNone Excellent Written texts PoorVariable VariableNoneNone Studies of mass media PoorPoorVariable Excellent None Laboratory experiments Poor Excellent Variable Excellent Excellent Direct elicitation Poor Excellent Fair Excellent Excellent Introspection Poor Excellent None None Excellent
Percent [r] in rapid and anonymous study of three New York City department stores, 1962 Source: Labov 1966
Percent [r] in rapid and anonymous study of three New York City department stores, 1962 and 1986 Source: Labov 1966, Fowler 1986
Percent [r] in by age in Saks Source: Labov 1966
Percent [r] in by age in Saks, 1962 and 1986 Source: Labov 1966, Fowler 1986
Percent [r] in by age in Macy’s Source: Labov 1966
Percent [r] in by age in Macy’s, 1962 and 1986 Source: Labov 1966, Fowler 1986
Percent [r] in by stress and position Source: Labov 1966
Percent [r] in by stress and position, 1982 and 1986 Source: Labov 1966, Fowler 1986
Overall increase in percent [r] from 1962 to 1986 Source: Labov 1966, Fowler 1986
Overall increase in percent [r] from 1962 to 1996 Tiernan 1996 Fowler 1986 Labov 1962 Source: Labov 1966, Fowler 1986, Tiernan 1996
Social and stylistic stratification of (r) in the random sample of the Lower East Side of New York City [N=81] SOCIO-ECONOMICCLASS higher The cross-over pattern lower
The introduction of constricted /r/ by upper middle class youth in the spontaneous speech of the Lower East Side sample of New York City [N=81]
Subjective evaluation of (r) in matched guise tests for New Yorkers by age and social class
Percent positive response to (r) on two-choice subjective reaction test in New York City
The metropolis: a speech community with a high degree of social stratification on a uniform structural and evaluative base
Stratification by occupation in white employees at Macy’s (1962)