Download
1 / 22
220 likes | 234 Vues
Objective. Write and evaluate exponential expressions to model growth and decay situations. Vocabulary. exponential function base exponential growth exponential decay. Exponential function – the power is a variable The parent exponential function is f ( x ) = b x

E N D
Objective Write and evaluate exponential expressions to model growth and decay situations.
Vocabulary exponential function base exponential growth exponential decay
Exponential function – the power is a variable The parent exponential function is f(x) = bx -b is the base and is a constant (regular #) - x is the exponent and is a variable **Why do you think the base must be bigger than 0 and also cannot be 1? BONUS POINTS IF YOU CAN ANSWER THIS!!!!!
The graph of the parent function f(x) = 2xis shown here. The domain is all real numbers and the range is {y|y > 0}.
Notice as the x-values decrease, the graph of the function gets closer and closer to the x-axis. The function never reaches the x-axis because the value of 2xcannot be zero. In this case, the x-axis is an asymptote. An asymptote is a line that a graphed function approaches as the value of x gets very large or very small.
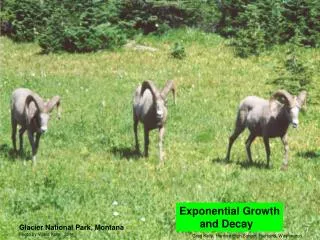
There are TONS of real world examples of exponential functions. Such as…..Moore’s law, a rule used in the computer industry, states that the number of transistors per integrated circuit (the processing power) doubles every year. Beginning in the early days of integrated circuits, the growth in capacity may be approximated by this table.
A function of the form f(x) = abx with a > 0 When b > 1, is an exponential growth function, which increases as x increases. **base is bigger than 1 When 0 < b < 1, the function is called an exponential decay function, which decreases as x increases. **b is a fraction or decimal between 0 and 1
The base , ,is less than 1. This is an exponential decay function. Examples for your notes: Tell whether the function shows growth or decay. Then graph. Step 1 Find the value of the base.
Example 1A Continued Step 2 Graph the function by using a table of values.
Tell whether the function shows growth or decay. Then graph. g(x) = 100(1.05)x Step 1 Find the value of the base. The base, 1.05, is greater than 1. This is an exponential growth function. g(x) = 100(1.05)x
Example 1B Continued Step 2 Graph the function.
Check It Out! Example 1 Tell whether the function p(x) = 5(1.2x) shows growth or decay. Then graph. Step 1 Find the value of the base. p(x) = 5(1.2x) The base , 1.2, is greater than 1. This is an exponential growth function.
Check It Out! Example 1 Continued Step 2 Graph the function by using a table of values.
Other examples of growth and decay by a constant percent increase or decrease can be calculated with the following formula: In the formula, the base of the exponential expression, 1 + r,is called the growth factor. Similarly, 1 – ris the decay factor. Copy this info and I will explain it in the next slide.
Example 2: Economics Application Clara invests $5000 in an account that pays 6.25% interest per year. Write a function to model the growth in the value of her investment. f(t) = a(1 + r)t Exponential growth function. f(t) = 5000(1 + 0.0625)t Substitute 5000 for a and 0.0625 for r. f(t) = 5000(1.0625)t Simplify.
Check It Out! Example 2 In 1981, the Australian humpback whale population was 350 and increased at a rate of 14% each year since then. Write a function to model population growth. How many whales will there be in 2001? In 2017? P(t) = a(1 + r)t Exponential growth function. P(t) = 350(1 + 0.14)t Substitute 350 for a and 0.14 for r. P(t) = 350(1.14)t Simplify.
Graph the function. Use to find when the population will reach 20,000. What if we wanted to predict WHEN the population would reach 20,000? If Mrs. Darden and Mrs. Mansfield allowed you to use a calculator, you could graph it and trace the function until the output reached 20,000. It will take about 31 years for the population to reach 20,000. But no calculator for you!!! We need to solve for x (or time in this function)….but how do we undo a variable that is in a power? To be continued…..
Example 3: Depreciation Application A city population, which was initially 15,500, has been dropping 3% a year. Write an exponential function and graph the function. Use the graph to predict when the population will drop below 8000. f(t) = a(1 – r)t Exponential decay function. f(t) = 15,500(1 – 0.03)t Substitute 15,500 for a and 0.03 for r. f(t) = 15,500(0.97)t Simplify.
Graph the function. Use to find when the population will fall below 8000. Example 3 Continued 10,000 150 0 0 It will take about 22 years for the population to fall below 8000.
Check It Out! Example 3 A motor scooter purchased for $1000 depreciates at an annual rate of 15%. Write an exponential function and graph the function. Use the graph to predict when the value will fall below $100. f(t) = a(1 – r)t Exponential decay function. f(t) = 1000(1 – 0.15)t Substitute 1,000 for a and 0.15 for r. f(t) = 1000(0.85)t Simplify.
Graph the function. Use to find when the value will fall below 100. Check It Out! Example 3 Continued 200 100 0 0 It will take about 14.2 years for the value to fall below 100.
Lesson Quiz In 2000, the world population was 6.08 billion and was increasing at a rate 1.21% each year. 1. Write a function for world population. Does the function represent growth or decay? P(t) = 6.08(1.0121)t 2. Predict the population in 2020. ≈ 7.73 billion The value of a $3000 computer decreases about 30% each year. 3. Write a function for the computer’s value. Does the function represent growth or decay? V(t)≈ 3000(0.7)t ≈ $720.30 4. Predict the value in 4 years.