Download
1 / 31
310 likes | 438 Vues
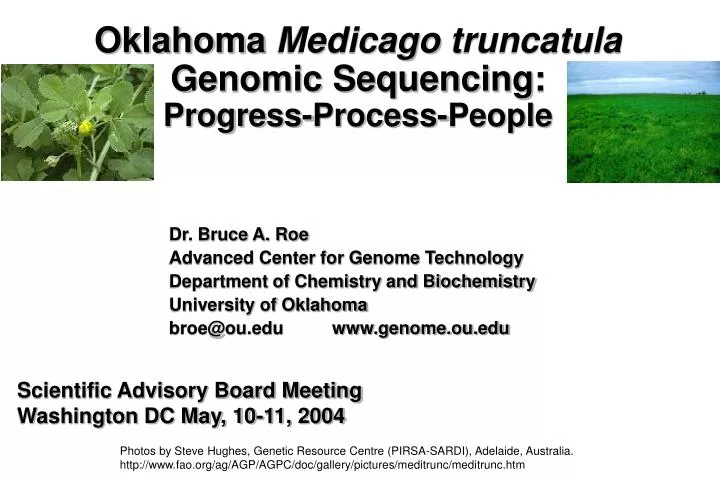
Oklahoma Medicago truncatula Genomic Sequencing: Progress-Process-People. Dr. Bruce A. Roe Advanced Center for Genome Technology Department of Chemistry and Biochemistry University of Oklahoma broe@ou.edu www.genome.ou.edu. Scientific Advisory Board Meeting

E N D
Oklahoma Medicagotruncatula Genomic Sequencing:Progress-Process-People Dr. Bruce A. Roe Advanced Center for Genome Technology Department of Chemistry and Biochemistry University of Oklahoma broe@ou.edu www.genome.ou.edu Scientific Advisory Board Meeting Washington DC May, 10-11, 2004 Photos by Steve Hughes, Genetic Resource Centre (PIRSA-SARDI), Adelaide, Australia. http://www.fao.org/ag/AGP/AGPC/doc/gallery/pictures/meditrunc/meditrunc.htm
Why sequence the Medicago genome? • An important forage crop • A genetically tractable model legume • A relatively small (~450 Mbp) diploid genome • Active legume research community • Medicago Research Consortium • Large collection of ESTs • Excellent BAC library • Integrated physical and genetic map • Large number of BAC-end sequences
Medicago truncatula Sequencing Centers ChromosomeCenterEstimated SizeaProjected BACSb 1 Oklahoma 51 µm / 30 Mbp 156 2 TIGR 42 µm / 25 Mbp 130 3 Sanger/JIC 63 µm / 38 Mbp 197 4 Oklahoma 61 µm / 37 Mbp 192 5 Genoscope/INRA 39 µm / 23 Mbp 119 6 Oklahoma 22 µm / 13 Mbp 68 7 TIGR 43 µm / 26 Mbp 135 8 Oklahoma 26 µm / 16 Mbp 83 a Size estimates are based on observations of pachytene chromosomes and previous (upper) estimates of 600 kbp / µm in euchromatic regions of the Medicago genome. b Projections based on estimated chromosome size, a total euchromatic size of 200 Mbp, an average 100 kbp non-overlapping coverage by each BAC, and proportional distribution of previously sequenced BAC clones.
Medicago truncatula Sequencing Progress at OU 120000000 May 4, 2004 October 1, 2003 100000000 ~ 20 Mb Finished ~ 20 Mb Total 80000000 60000000 40000000 20000000 0 May-02
Actual and Projected BAC Sequencing Goals OU-ACGT Actual Projected 5-4-049-3-04 Number of BACs started or finished 140 250 Number of BACs finished 159 125 BACs in GenBank Submitted by OU-ACGT DateDraftFinishedTotal Number of BACs Oct 12, 2003 593 200 793 May 2, 2004 574 359 933
Sequence at the University of Oklahoma Genome Center, OU-ACGT Colony Piking (QPixIITM) BAC DNA Isolation Growing subclones (HiGroTM) DNA shearing (HydroshearTM)
Sequence at the University of Oklahoma Genome Center, OU-ACGT Sequencing (ABI 3700) Subclone Isolation I (Mini-StaccatoTM) Thermocycling (ABI 9700) DNA Sequencing Reaction Pipetting (VPrepTM)
Sequence at the University of Oklahoma Genome Center, OU-ACGT GenBank Closure Data assembly and Analysis Finishing Primer Synthesis Informatics
Sequence at the University of Oklahoma Genome Center, OU-ACGT Graduate Students focusing on Medicago truncatula genomics Administrative Staff
Integrating the physical and genetic maps using sequence data • The UC-Davis FPC mapped BACs have been incorporated into Genome Browser • The results of a Blastn search of the BAC sequence data vs the BAC-end sequence data also have been incorporated into our Genome Browser • Investigate and resolve any differences between these maps and the sequence data. • Iterate as new BAC sequence data becomes available to refine the Genome Browser map. • Use the map as a visual aid showing the evidence needed to pick the next round(s) of BAC clones for sequencing.
Supercontig Construction BAC shotgun sequence data Phase 3 • Using a modified version of the SSAHA algorithm coupled with crossmatch • Identify the sequence overlaps between BACs • Search the BAC-end sequences for overlap Phase 2 Phase 1 BAC sequence overlaps are scored by combining the extent of overlap and supporting BAC-end pairs. Super-contigs then are built in the order of highest scoring overlaps to lowest scoring overlaps.
Caveates • Repeated sequences sometimes cause misplacement of BAC clones. • In some cases the sequences of the BAC clones do not overlap as predicted by the ends of the BACs placed via FPC on the map. • There sometimes are multiple clones in the same BAC well making it difficult to find the correct positioning of the sequenced BAC on the map.
Key: Light Green = one BAC end matches to OU-AGCT BAC Dark Green = two BAC ends match to OU-AGCT BAC Dark Blue = OU-ACGT BAC sequence Purple = BACs with BAC end sequences
Key: Light Green = one BAC end matches to OU-AGCT BAC Dark Green = two BAC ends match to OU-AGCT BAC Dark Blue = OU-ACGT BAC sequence Purple = BACs with BAC end sequences
FgeneSH Genscan Gene Size Distribution (All Sequence Data) (FgenesH vs. Genscan) 4500 4000 3500 13,396 FgeneSH predicted genes 11,488 Genscan predicted genes 3000 Number of Genes 2500 2000 1500 1000 500 0 1-1000 7001-8000 6001-7000 8001-9000 2001-3000 5001-6000 3001-4000 4001-5000 1001-2000 17001-18000 9001-10000 19001-20000 20001-above 15001-16000 10001-11000 11001-12000 18001-19000 16001-17000 12001-13000 13001-14000 14001-15000 Gene Size Range
FgeneSH Genscan Exon Size Distribution (All Sequence Data) (FgenesH vs. Genscan) 20000 18000 59,808 FgeneSH predicted exons 55,792 Genscan predicted exons 16000 14000 Number of Exons 12000 10000 8000 6000 4000 2000 0 1-50 401-500 51-100 301-400 501-600 601-700 701-800 801-900 101-200 201-300 901-1000 3001-3500 1501-2000 2001-2500 3501-4000 1001-1500 2501-3000 Exon Size Range
FgeneSH Genscan Intron Size Distribution (All Sequence Data) (FgenesH vs. Genscan) 12000 10000 46,412 FgeneSH predicted introns 44,305 Genscan predicted introns 8000 Number of Introns 6000 4000 2000 0 1-50 401-500 51-100 501-600 301-400 601-700 701-800 801-900 101-200 201-300 2501-3000 901-1000 3001-3500 3501-4000 1501-2000 2001-2500 1001-1500 Intron Size Range
Gene Density of the ~450 Mb Medicago truncatula genome FgeneSHGenscan Total number of genes 13,397 11,488 Total length of genes 30,793,326 51,687,528 Total exon length 15,794,243 14,400,445 Total number of exons 59,808 55,792 Total intron length 14,999,083 37,287,083 Total number of introns 46,412 44,305 ___________________________________________________________________ Base Pairs Sequenced Phase 1 Phase 2 Phase3 Total: 95,660,469 24,169,898 32,579,732 38,910,839 ___________________________________________________________________ Gene Space (Gene Length/BP Sequenced) 35% 59% _______________________________________________________ Gene Density (Genes/200Mb) 30,649 26,281 1 gene/6.5 kb 1 gene/7.6 kb _______________________________________________________ Arabidopsis 25,498 protein coding genes
Data Analysis and Annotation Schema BAC Sequences Concatenated Contig Sequences (>5 KB) Medic Repeats Genscan FgeneSH BLASTX (Arab.) BLASTN (GB-EST) BLASTX (GB- NR) BLASTN (TIGR_Plant gene Indices) BLASTP (against KEGG-A. thaliana) KEGG Metabolic Reconstruction GBrowse
Functional Distribution Overview of M. truncatula Predicted ORFs (via BlastP vs Arabidopsis) No Arabidopsis Homologue 29%** Metabolism 28% Putative 40% Genetic Information & Processing 2% Cellular Processes 1% ** only 3% of the 29% No Arabidopsis homologues had homology to GenBank with the majority homologous to genes in pea and rice Environmental Information Processing <1%
Metabolism Biodegradation of Xenobiotics 17% Carbohydrate Metabolism 10% Energy Metabolism 5% Lipid Metabolism 1% Nucleotide Metabolism 3% Biosynthesis of Secondary Metabolites 13% Amino acid Metabolism 6% Metabolism of Other Amino Acids 2% Metabolism of Cofactors & Vitamins11% Metabolism of Complex Carbohydrates 13% Metabolism of Complex Lipids 19%
Genetic Information & Processing Translation 54% Sorting and Degradation 23% Replication 3% Transcription 20%
Examples of Reconstructed Pathways in M. truncatula (Purine and Pyrimidine Metabolism) Key: Green Background = A. thaliana gene Red Numbers = Gene also found in M. truncatula
Examples of Reconstructed Pathways in M. truncatula (CO2 Fixation and Nitrogen Metabolism) Key: Green Background = A. thaliana gene Red Numbers = Gene also found in M. truncatula
Examples of Reconstructed Pathways in M. truncatula (Aminoacyl-tRNA synthesis and Globoside Metabolism) Key: Green Background = A. thaliana gene Red Numbers = Gene also found in M. truncatula
Examples of Reconstructed Pathways in M. truncatula (Circadian Rhythm) Key: Green Background = A. thaliana gene Red Numbers = Gene also found in M. truncatula
Repeats in Medicago Method: Repeats by definition are those genomic segments repeated in different places in a genome. The segments are typically a few hundred to a few thousand base pairs. It is expected and observed that if we count the frequency of a short word of 10-20 bp of a genome, repeated regions have higher frequency than non-repeated region. For medicago, we used a word length of 15 bp and tabulated the frequency of every word from the shotgun reads of ~800 BACs. To predict repeats, we scan a given sequence to find the frequency of every word in our pre-calculated table. Regions of at least 100 bp with word frequency about 30 are marked as repeats. Note that with a word length of 15 bp, the number of all possible unique word is ~500 Million. Since the expected size of the Medicago genome is about the same size, each word is not expected to occur more than once by random chance. Advantage: We don’t need to know anything about the nature of any repeat to perform this prediction, unlike other repeat programs such as Repeatmasker. The data comes directly from shotgun data, not depending on any assembly results. The calculation is fast. Disadvantage: The choice of threshold frequency value affects the sensitivity and selectivity of this method. A too high value tends to only keep high copy number repeats, missing low copy number repeats. A too low value will generate false positive repeats.
Repeats A total of ~95 MB of medicago BAC data contains ~46 MB (~48%) repeated sequence.
Three Year Plan • Obtain the contiguous sequence of the Gene Rich regions of four of the 8 Medicago truncatula genome at OU, with the remaining four being completed by our international partners at TIGR, Sanger, and Genoscope. • This information will serve as a solid foundation for anticipated comparative and functional legume genomics.