Download
1 / 24
240 likes | 355 Vues
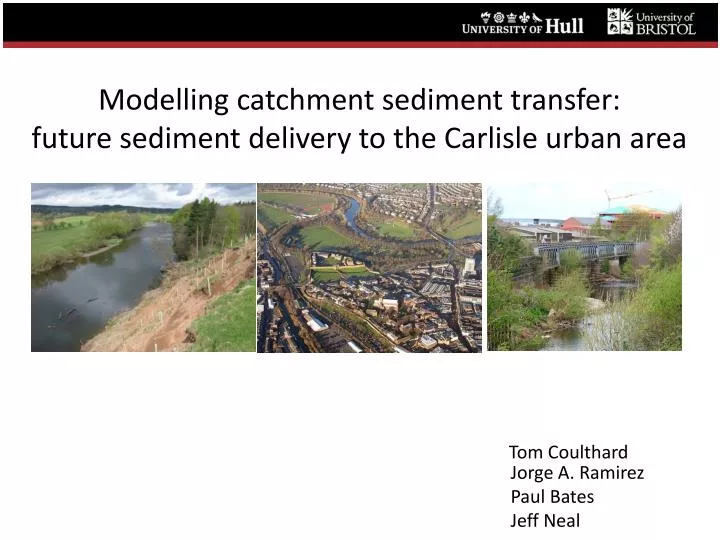
Modelling catchment sediment transfer: future sediment delivery to the Carlisle urban area . Tom Coulthard. Jorge A. Ramirez Paul Bates Jeff Neal. Blue, flood outline before, Red flood outline after. Project Aims/Summary.

E N D
Modelling catchment sediment transfer: future sediment delivery to the Carlisle urban area Tom Coulthard Jorge A. Ramirez Paul Bates Jeff Neal
Project Aims/Summary • To model sediment delivery from the Eden catchment and how this can affect flooding in Carlisle • Using CAESAR, to model morphological change in the Eden river catchmentand Carlisle reach • Use different climate & discharge records to simulate impact of climate and land cover change • Transfer updated DTM to Bristol for hydraulic modelling
What is CAESAR? • Catchment or Reach based cellular model • Models Morphological Change • Hydrological model • Adaptation of TOPMODEL • Hydraulic model • Simple 2d steady state flow model • Sediment transport • Bedload, 9 fractions using Wilcock & Crowe eqtn. • Suspended sediment, multiple fractions • Slope Processes • Slope failure (landslips) • Soil Creep
Main Tasks • Two modelling tasks: • 1. Model sediment and water from catchmentsdraining into Carlisle • 2. Model morphological changes in Carlisle reach
1. CAESAR catchment scale tasks • Produce sediment output for the Eden river at Carlisle • Existing climate • Climate scenarios • Land cover change
Eden river sub-catchments Petteril • 50m spatial resolution • 6 sub-catchments • Divisions coincide with flow gauges Carlisle Irthing Caldew Lower Eden Upper Eden Eamont 25 Km
Linking sub-catchments Carlisle Carlisle Deposition Erosion Discharge Sediment
Initial conditions: grain size distribution • 40 sites visited • 173 photographs taken of • sediment on channel edge
Initial conditions: grain size distribution Photo analysis technique utilized to estimate individual grain sizes Finer Sediment 20% Adjusted grain size distributions to add unmeasurable small grain sizes ( < 0.3mm ) Grain size distributions per catchment/reach Grain size distributions all records
Climate change: What we wanted to do... • Use UKCP09 weather generator to predict future rainfall • Use rainfall predictions as divers for the CAESAR morphological model • Generate sediment yields (and updated DEMs) for futures.
Climate Eamont Upper Eden Lower Eden 200000 100000 Cumulative rainfall, mm 0 Irthing Caldew Petteril 200000 100000 0 200,000 0 200,000 200,000 0 400,000 0 400,000 600,000 400,000 600,000 600,000 Time, hours
Catchment simulations • 75 year simulation • 13 years of hourly rainfall repeated and amplified by climate factor • 13 years chosen as only continuous period across all catchments/raingauges • Climate factor increased by 10, 20 and 30% • Record DEM’s and sediment outputs
Catchment Sediment output Eamont Lower Eden Upper Eden 1000000 0 Cumulative sediment, m3 Irthing Petteril Caldew 1000000 0 200,000 0 200,000 200,000 0 400,000 0 400,000 600,000 400,000 600,000 600,000 Time, hours
2. CAESAR reach scale tasks • Produce future bed elevations for the Eden reach at Carlisle: • Determine how this affects flood inundation
Water inputs Hourly Discharge 30000000 Eden Caldew 11% Petteril 5% Cumulative Discharge ( m3/sec) 20000000 10000000 Caldew Eden 84% Petteril 0 400,000 0 200,000 600,000 Time, hours
Sediment inputs Petteril Lower Eden Caldew 1000000 Cumulative sediment, m3 0 200,000 0 200,000 200,000 0 400,000 0 400,000 600,000 400,000 600,000 600,000 Time, hours Hourly lumped sediment 83% 5% 12% Petteril Eden Caldew
Changes in bed elevation Baseline +10% +30% +20% 6m(Erosion) -6m(Deposition)
LISFLOOD-FP reference DTM • Model formulation with inertia (Bates et al., 2010) • 2D channel and floodplain. • Normal depth at boundary with slope 0.0006 mm-1 (Horritt et al., 2010) +30% Depth, m 11 0
Bed elevations affect on flood levels Baseline +10% +30% +20% ∆ max water depth, m 3 (more flooding) Difference in maximum water elevation (new – original) (less flooding) - 2
Previous trial runs (increasing sediment input) -50% Baseline +100% +50% 5m(Erosion) -6m(Deposition)
Conclusions • Morphological changes in the channel can have profound influences on inundation levels • relative to changes in flooding caused by climate change? • Changes in flood level directly linked to erosion/deposition • Incision/aggradation alters conveyance • Changes in channel pattern (cutoff) have a fairly profound affect on inundation patterns • Relationship between discharge increase and changes in sediment yield is very site specific.. • Hard to apply a generic rule to all reaches