Download
1 / 32
400 likes | 945 Vues
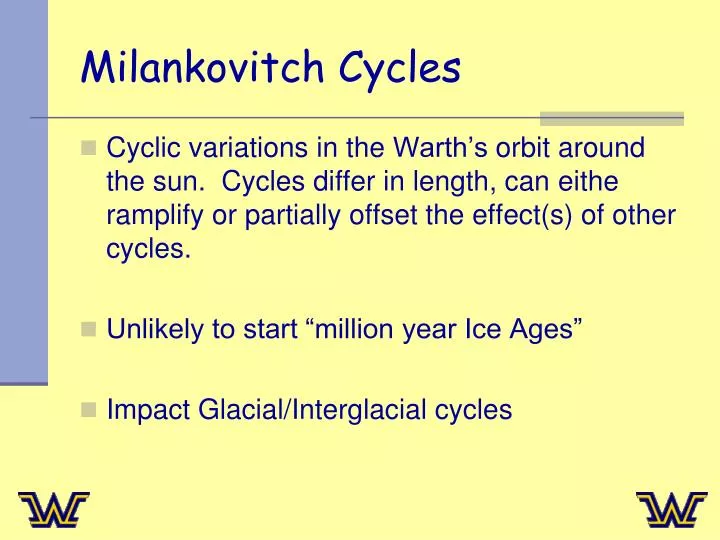
Milankovitch Cycles. Cyclic variations in the Warth’s orbit around the sun. Cycles differ in length, can eithe ramplify or partially offset the effect(s) of other cycles. Unlikely to start “million year Ice Ages” Impact Glacial/Interglacial cycles. Different cycles—3 of them.

E N D
Milankovitch Cycles • Cyclic variations in the Warth’s orbit around the sun. Cycles differ in length, can eitheramplify or partially offset the effect(s) of other cycles. • Unlikely to start “million year Ice Ages” • Impact Glacial/Interglacial cycles
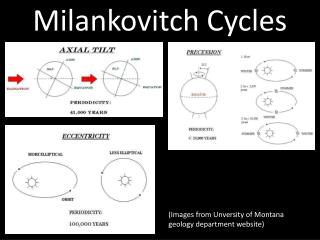
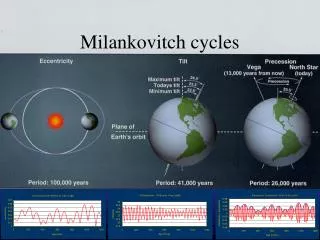
Different cycles—3 of them Obliquity, precession and eccentricitry Shown here, obliquity—measures the “axial tilt” or the degree from ‘true north Currently 23.4°, declining Range 22.1—24.5° Higher values, more seasonal variation, less glaciation
Precession, or rotation about Earth not perfectly spherical Rotates (wobbles) like a top
Eccentric—not the goofy kind • Changes in the shape of the orbit also have effects on climate. • More spherical orbits (current) result in more solar energy reaching earth. • 6 % difference between Jan/July (more circular) • 25-30% difference more elliptical • More elliptical orbits result in greater energy loss • ~3% difference in the distance energy travels
Periodicity of cycles ` • Axial tilt—41,000 years. Considered the dominant ‘driver’ of glacial/interglacial cycles for the last 3 million years.
Temps the past 2000 years In the past 100 years, the average global temperature rose by about 0.6 °C Contrast that with the little ice age—which corresponds to the traditional ‘timeline’ of AGW activists. 1850-ish Warmer 1000 years ago than today—no Greenland SUV’s, etc.
Regions of the last 1400 years • 1) `Medieval Warm Period' (AD 700 - 1300)2) `Sporer Minimum' cool period (AD 1300 - 1500) 3) Brief climatic warming (AD 1500 - 1560) 4) `Little Ice Age' (`Maunder Minimum') (AD 1560 - 1830) 5) Brief warmer period (AD 1830 - 1870) 6) Brief cool period (AD 1870 - 1910) 7) 20th century warm period (AD 1910 - 2000)
Even further back…BC Graph produced from an analysis of 14 C data obtained from sediment layers in the Sargasso Sea (Bermuda) Analyzed marine organisms in sea-bed sediments. Also note this corresponds to sea temperatures (surface temps) Correlates to the previous graphic, MWP and LIA both prominently positioned
More non-tree ring evidence • Carribbean sea oxygen isotope analysis in coral skeletons—sea was 2-3 C cooler in the LIA (and confirms MWP) • Ocean sediment analysis off of West Africa • Lake beds in East Africa, glaciers in Peru, sediment studies in Canada, Taiwan, Japan and even Australia…all confirm LIA/MWP • So…
Hockey Sticks off the ice… All hell breaks loose, In 1995, Michael Mann (Penn State) along with several co-workers, produced the following graph Featured prominently in the IPCC—THE body that produced a document utilized by nearly every government on the planet.
Something else that could ‘drive’ earth’s climate? • Hmmm…how about that great big yellow orb 100 million miles away? • We have little idea of the weather here (yes weather) on earth, how can we POSSIBLY know with any certainty what goes on inside that great big burbling cauldron of nuclear boom-boom? • We don’t…but the sun DOES give clues.
Another view of sunspots v T Sun has a general 11 year ‘sunspot cycle’ Notice the absolute dearth of spots in the “MM” period highlighted. Also is the LIA Activity in the 20th century a little higher.
Sunspot activity begs… • 1) If the Medieval Warm Period was warmer than today, with no greenhouse gas contribution, what would be so unusual about modern times being warm also? • 2) If the variable sun caused both the Medieval Warm Period and the Little Ice Age, would not the stronger solar activity of the 20th century account for most, if not all, of the claimed 20th century warmth?
Lets look at that activity… Note several things here…the Maunder Minimum is clearly evident—though note the y-axis scale does amplify/exaggerate it. Increased all wavelengths of light. UV, vis and IR. Increased energy ‘in’ corresponds to increased energy ‘out’ or an increase in temp
Solar ‘drivers’ one explanation • Like I’ve said before—climate is a complicated collection of 100’s of variables. • likelihood of one variable ‘driving climate’? • Sun perhaps the most likely of all (if one drives) • Martian ice caps also melting (??) • Bit player (390 ppm?) well…perhaps NOT well established. • Aerosols, methane, water vapor, clouds (cool and warm), CO2, core heat, ocean circulation
atmospheric interactions • The atmosphere and oceans exchange CO2--dissolves in cold polar water and sinks into the deep ocean. It is released by “outgassing” in warm upwelling water near the equator. • Sea ice hinders the exchanges of heat, water, and gases between atmosphere and oceans. Reflects light. • The biosphere – where plants and animals live both on land and in the ocean -- influences the carbon dioxide concentration in the atmosphere through photosynthesis and respiration. • The terrestrial biosphere influences the water cycle by taking in liquid water from the soils and releasing it as water vapor (evapotranspiration) to the atmosphere. • The optical properties (i.e., the albedo) of the biosphere (land cover) and cloud cover influence how much solar radiation is reflected upward.
CO2 –the world’s villian? • Current CO2 levels are around 390 ppm. That’s higher than at any time in the past say million years. • This concerns some people. Rightly so,
Leading or lagging indicator? Taken from a site called “joNova”. Vostok—Russian station in Antarctica. Took core samples. Extrapolated climate data and CO2 levels from them…about 400,000 years worth. Same source as previous graphic.
IPCC—InterGOVERNMENTAL Panel on Climate Change • I’m leery of any ‘government’ body meddling in scientific affairs. • Published several reports—1990, 1995, 2001 and most recently 2007. Conclusions? • human activites were warming the planet. • Fossil fuel use (concomitant CO2 emission) • Each subsequent report “more” “stronger” evidence supporting this conclusion. • Momentum reached a crescendo…
The Politics of Climate • 2006—Al Gore book and movie “Truth” • Won an Academy Award • Won a Nobel Prize (shared with IPCC) • Came down on nitrous oxide, methane from agriculture too… • This latest IPCC report…in addition to ICT, had multiple errors. Himalayan glaciers? • But “Climategate” really opened the floodgates
Climategate…the background • Russian hackers cracked the database at the University of East Anglica’s Climate Center • Distributed 1000’s of e-mails to media outlets • Senders had prominent roles in the Policies of IPCC and Climate Science in general • Serious breech of ethics…
Content of the leaked e-mails • Refusal to share climate data • Plotted to keep dissenting scientists from being published • Discarded original data • Cherry picked data (omitting ‘cooler’ data) • …threatened to ‘redefine’ peer-reviewed science (perhaps the most egregious error)
A LOT of information IPCC • Not all of this report was necessarily ‘wrong’. • Debated? Absolutely. Consensus? Nope • GWPP--~32,000 American Scientists signed a petition stating their opposition to ‘consensus’ • More than 700 scientists oppose the IPCC, including several of the contributing authors • Why???
Recall from first week • Risk? Can’t eliminate it completely. • Best you can do is MINIMIZE it • Yeah, like the TSA? Thoughts on THAT? • Hard to minimize risk if you don’t know WHAT the risk is!! • Furthermore, it makes LITTLE sense to draft a comprehensive policy (trillions of dollars) to combat something that may or may not even be a problem!!
Doesn’t stop the DC idiots • Cap and trade (cap and tax if you oppose) • Tax on the emission of CO2 • Companies buy allowances (permits) to emit • Charge ultimately borne by consumer. • As CO2 levels cut further, fewer allowances • …one way to make ‘alternative energy’ cost effective—current thoughts $20 ton CO2 • Translates to about $0.50 gallon gas increase, • Failed to pass both houses of Congress in ‘09
Doesn’t stop DC idiots part 2 • Can do an ‘end-around’ the constitution (and the legislative branch of government). • Clean Air Act gives the EPA the power to regulate pollutants. • 2007 Supreme Court Decision declared CO2 and five other GHG’s as pollutants. • Gives EPA power to impose sanctions that Congress couldn’t. • Relied heavily on 2007 IPCC report
Self-serving at all? • EPA would need increased funding to implement and enforce these regulations • Has vested interest in making sure the cap tax more than pays for the bloating of another federal bureaucracy. Hmmm… • Ask yourself this question…to whom does the EPA answer?
Copenhagen Consensus… • Started in 2004, conducted every four years (like olympics) • Way to set global priorities or opportunitiues • At gvmnt, philanthropic, and/or personal levels • Began with a simple question • Imagine you had $75bn to donate to worthwhile causes. What would you do, and where should we start?
So, what are those problems • The Ten most ‘pressing’ problems globally • Air Pollution • Conflicts • Diseases • Education • Global Warming • Malnutrition and Hunger • Sanitation and Water • Subsidies and Trade Barriers • Terrorism • Women and Development
Projects--expanded • Each project has several categories • 44 categories in all • Allocating resources takes serious thought • Consequences to those decisions—variables? • $$ social legal • Scientific Military religious • Political sexism • No one “RIGHT” answer…value system (own)
Your “Thanksgiving” assignment • Personal analysis? I eliminated 15 of these right off the bat. • Assigned the other 29 on a 1-10 scale • Your assignment…do the same for all 44 • I have both types of analyses ($$ and not) • Due at the beginning of class next week • I’m not the preachy type…but we do have a lot for which to be thankful…