Download
1 / 19
760 likes | 3.87k Vues
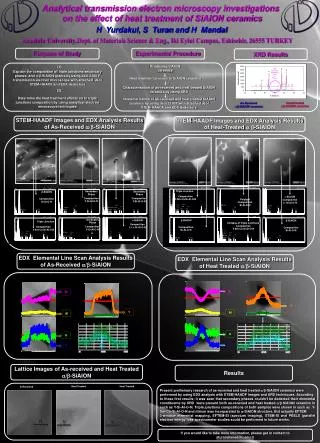
High Resolution Transmission Electron Microscopy (HRTEM). Resolution? Minimum resolving power? High resolution?. 0.61 l /NA. l /2NA. Resolution Criteria. Rayleigh’s description. Abbe’s description. Aberration free systems. The Role of an Optical System.

E N D
High Resolution Transmission Electron Microscopy (HRTEM) Resolution? Minimum resolving power? High resolution?
0.61l/NA l/2NA Resolution Criteria Rayleigh’s description Abbe’s description Aberration free systems
The Role of an Optical System means convolution which Indicates the two functions are “folded together” h(r) is the point spread function
In reciprocal space The factors contributing to H(u) include: Aperture → The aperture function A(u) Attenuation of the wave → The envelope function E(u) Aberration of the lens → The aberration funciton B(u) B(u) = exp [-i c(u)] • Each point in the specimen plane is transformed into an extended region in the final image • Each point in the specimen has contributions from many points in the specimen This limits the resolution!
Weak-Phase-Object Approximation (WPOA) • Model: f(r) = exp[-iσVt(r)] σ is the interaction constant (It tends to be a constant when energy of electron increases) Vt is the potential an electron sees when passing the specimen Treating the specimen as a “phase object”: no attenuation of the intensity WPOA: very thin sample so Vt << 1 Then f(r) = 1-iσVt(r) The wavefunction seen in the image is given by [1-iσVt(r)] h(r) Exit wavefunction (or specimen wavefunction)
Applying WPOA to TEM Apply WPOA f(r) = 1-iσVt(r) to B(u) = exp [-ic(u)] The observed intensity is I = 1 + 2σVt(r) sin(r) We can then set B(u) = 2 sinc(u) The Objective lens transfer function is defined as: T(u) = A(u)E(u) 2 sin c(u) Why only see sin(r) ??? Pay attention to the “2”, which is always ignored! Also called contrast transfer function (CTF) in the WPOA
The Phase Distortion Function Phase distortion function c(u): has the form of a phase shift expressed as 2p/l times the path differences travelled by those waves affected by spherical aberration (Cs), defocus (Δf), and astigmation (Ca). stigmated Real space and inverse space is connected from the Bragg’s law: 2d sinq = n l → 2q = lu for small angle q
The Contrast Transfer Function The effect of different Cs and Δf on CTF
Important points to notice: • CTF is oscillatory: there are "passbands" where it is NOT equal to zero (good "transmittance") and there are "gaps" where it IS equal (or very close to) zero (no "transmittance"). • When it is negative, positive phase contrast occurs, meaning that atoms will appear dark on a bright background. • When it is positive, negative phase contrast occurs, meaning that atoms will appear bright on a dark background. • When it is equal to zero, there is no contrast (information transfer) for this spatial frequency.
Other important features: • CTF starts at 0 and decreases, then • CTF stays almost constant and close to -1 (providing a broad band of good transmittance), then • CTF starts to increase, and • CTF crosses the u-axis, and then • CTF repeatedly crosses the u-axis as u increases. • CTF can continue forever but, in reality, it is modified by envelope functions and eventually dies off. Effect of the envelope functions can be represented as:
1 Sch 0.4 Sch 1 Scherzer 1.2 Sch 0 defocus Scherzer Defocus • In Scherzer defocus, one aims to counter the term in u4 with the parabolic term Δfu2 of c(u). Thus by choosing the right defocus value Δf one flattens c(u) and creates a wide band where low spatial frequencies u are transferred into image intensity with a similar phase. • In 1949, Scherzer found that the optimum defocus (extended Scherzer defocus) is: The similar phase or “flat responding” is the underlying principle governing phase-contrast imaging in HRTEM The minimum contrast is very useful since it is the dark-field focus condition in STEM The resolution at the Scherzer defocus is obtained when Sinc(u) first crosses the axis: rsch = 0.66(Csl3)1/4 For a 200 KeV microscope The yellow curve is the damping envelope function
The Envelope function The resolution is also limited by the spatial coherence of the source and by chromatic effect: Teff = T(u)EcEa The envelope function imposes a “virtual aperture” in the back focal plane of the objective lens
Information limit goes well beyond point resolution limit for FEG microscopes (due to high spatial and temporal coherency). • For the microscopes with thermionic electron sources (LaB6 and W), the info limit usually coincides with the point resolution. • Phase contrast images are directly interpretable only up to the point resolution (Scherzer resolution limit). • If the information limit is beyond the point resolution limit, one needs to use image simulation software to interpret any detail beyond point resolution limit.
Spherical Aberration Correction A post-objective corrector proposed by Rose H. in 1990 and 1991 The hexapoles only affect non-paraxial rays (the dashed line)
FEG on Information Limit Other factors affect the envelope function: Es: spread angle of the source Es: specimen drift Es: specimen vibration ED: detector (requires very high resolution CCD camera, ok for film)
Focus Variation Technique Simulation of exit wave from a stack of recorded images for GaN[0001] For studying atomic structure and the quantum mechanical interaction, the information is contained in the exit wave function. We are not able to directly derive it from the Scherzer defocus method produced images
The Negative Spherical-aberration Imaging (NCSI) Cs = -40 mm Philips FEG CM 200 Image of the atomic structure of BaTiO3 [011] The information limit is about 0.125 nm The best current resolution is about 0.08 nm at NCEM: 300 KeV FEG Jia, C.L. and Urban, K. Science, 303, 2001 (2004)
The Negative Spherical-aberration Imaging (NCSI) Atomic structure of ferroelectric PZT Local displacement and polarization The precision of aberration-corrected TEM allows values for physical parameters to be derived directly on the atomic scale Urban, K. Science, 321, 506 (2008)
Summary • Resolution of HRTEM < 1 nm • HRTEM is useful for direct atomic level study like interface, dislocation, defects, etc. • Point-spread function • Weak-phase-object approximation (WPOA) • Contrast transfer function (CTF) • Point resolution and information limit • Image reconstruction