Download
1 / 1
20 likes | 113 Vues
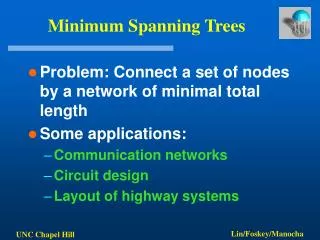
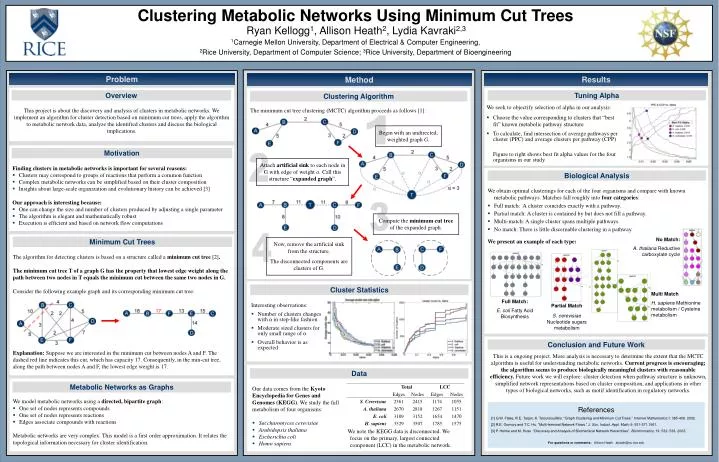
Multi Match H. sapiens Methionine metabolism / Cysteine metabolism . Clustering Metabolic Networks Using Minimum Cut Trees Ryan Kellogg 1 , Allison Heath 2 , Lydia Kavraki 2,3 1 Carnegie Mellon University, Department of Electrical & Computer Engineering,

E N D
Multi Match H. sapiens Methionine metabolism / Cysteine metabolism Clustering Metabolic Networks Using Minimum Cut Trees Ryan Kellogg1, Allison Heath2, Lydia Kavraki2,3 1Carnegie Mellon University,Department of Electrical & Computer Engineering, 2Rice University, Department of Computer Science; 3Rice University, Department of Bioengineering Problem Results Method This project is about the discovery and analysis of clusters in metabolic networks. We implement an algorithm for cluster detection based on minimum cut trees, apply the algorithm to metabolic network data, analyze the identified clusters and discuss the biological implications. The minimum cut tree clustering (MCTC) algorithm proceeds as follows [1]: Tuning Alpha Overview Clustering Algorithm • We seek to objectify selection of alpha in our analysis: • Choose the value corresponding to clusters that “best fit” known metabolic pathway structure • To calculate, find intersection of average pathways per cluster (PPC) and average clusters per pathway (CPP) Figure to right shows best fit alpha values for the four organisms in our study 1 Begin with an undirected, weighted graph G. • Finding clusters in metabolic networks is important for several reasons: • Clusters may correspond to groups of reactions that perform a common function • Complex metabolic networks can be simplified based on their cluster composition • Insights about large-scale organization and evolutionary history can be achieved [3] • Our approach is interesting because: • One can change the size and number of clusters produced by adjusting a single parameter • The algorithm is elegant and mathematically robust • Execution is efficient and based on network flow computations Motivation 2 Attach artificial sinkto each node in G with edge of weight α. Call this structure “expanded graph”. • We obtain optimal clusterings for each of the four organisms and compare with known metabolic pathways. Matches fall roughly into four categories: • Full match: A cluster coincides exactly with a pathway. • Partial match: A cluster is contained by but does not fill a pathway. • Multi-match: A single cluster spans multiple pathways. • No match: There is little discernable clustering in a pathway. We present an example of each type: Biological Analysis 3 Compute the minimum cut tree of the expanded graph. 4 No Match: A. thaliana Reductive carboxylate cycle The algorithm for detecting clusters is based on a structure called a minimum cut tree [2]. The minimum cut tree T of a graph G has the property that lowest edge weight along the path between two nodes in T equals the minimum cut between the same two nodes in G. Consider the following example graph and its corresponding minimum cut tree: Explanation: Suppose we are interested in the minimum cut between nodes A and F. The dashed red line indicates this cut, which has capacity 17. Consequently, in the min-cut tree, along the path between nodes A and F, the lowest edge weight is 17. Minimum Cut Trees Now, remove the artificial sink from the structure. The disconnected components are clusters of G. Cluster Statistics Full Match: E. coli Fatty Acid Biosynthesis Partial Match S. cerevisiaeNucleotide sugars metabolism Interesting observations: • Number of clusters changes with α in step-like fashion • Moderate sized clusters for only small range of α • Overall behavior is as expected Conclusion and Future Work This is a ongoing project. More analysis is necessary to determine the extent that the MCTC algorithm is useful for understanding metabolic networks. Current progress is encouraging; the algorithm seems to produce biologically meaningful clusters with reasonable efficiency. Future work we will explore: cluster detection when pathway structure is unknown, simplified network representations based on cluster composition, and applications in other types of biological networks, such as motif identification in regulatory networks. Data • We model metabolic networks using a directed, bipartite graph: • One set of nodes represents compounds • One set of nodes represents reactions • Edges associate compounds with reactions • Metabolic networks are very complex. This model is a first order approximation. It relates the • topological information necessary for cluster identification. • Our data comes from the Kyoto • Encyclopedia for Genes and • Genomes (KEGG). We study the full • metabolism of four organisms: • Saccharomyces cerevisiae • Arabidopsis thaliana • Escherichia coli • Homo sapiens Metabolic Networks as Graphs References [1] G.W. Flake, R.E. Tarjan, K. Tsioutsiouliklis. “Graph Clustering and Minimum Cut Trees.” Internet Mathematics;1: 385-408. 2002. [2] R.E. Gomory and T.C. Hu. “Multi-terminal Network Flows.” J. Soc. Indust. Appl. Math; 9: 551-571.1961. [3] P. Holme and M. Huss. “Discovery and Analysis of Biochemical Network Hierarchies”. Bioinformatics; 19: 532- 538. 2003. For questions or comments: Allison Heath aheath@cs.rice.edu