Download
1 / 14
140 likes | 250 Vues
States by Population Rank, Region, and Level of State Court Financing. “Pros” of State Court Funding. Traditional view--More stable and equitable funding More uniform access to justice More accountability Improve efficiency and effectiveness of Court operations

E N D
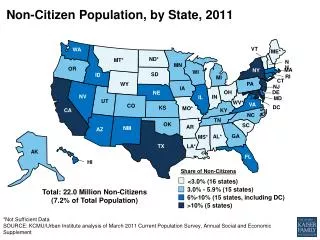
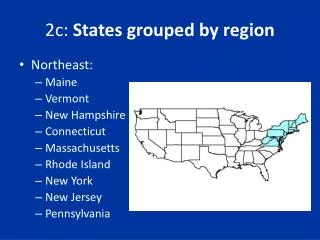
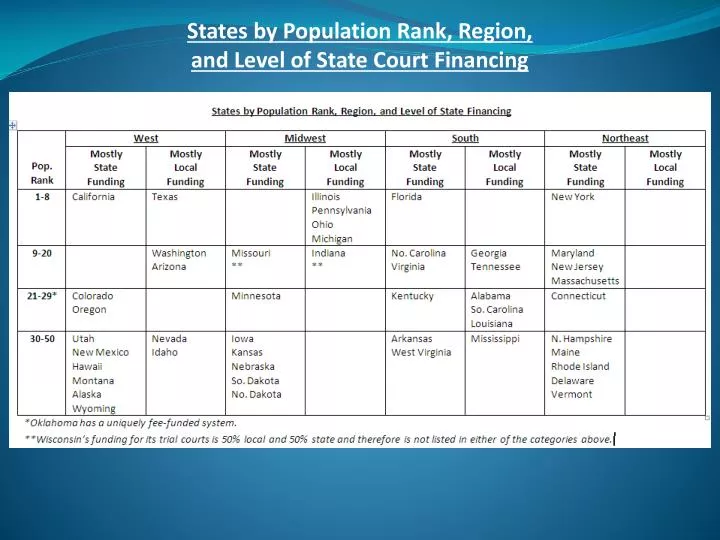
States by Population Rank, Region, and Level of State Court Financing
“Pros” of State Court Funding • Traditional view--More stable and equitable funding • More uniform access to justice • More accountability • Improve efficiency and effectiveness of Court operations • Regional disparities can be equalized • Lessons learned in the new economy
“Cons” of State Court Funding • Shifts authority to officials outside the local orbit • Undue centralization and bureaucracy • Higher costs • Insensitivity to unique local and public needs • Loss of revenue for local governments • Possible loss of employee jobs or diminution of benefits • Overdependence on one funding source • Lessons learned in the new economy
Partial Listing* of State vs. Local Court Funding For Adult and Juvenile Probation *Not all states provided statistical information.
State vs. Local Court Funding For Pubic Defender Offices
Midwest Regional States: General Jurisdiction Civil Filing Fees, Ranked from Lowest to Highest Amount s include surcharges. In Wisconsin’s little of the revenue collected goes to the courts.
How Do State Courts Use Program Revenue? Source: COSCA Survey, May 2007
States with Significant Program Revenue California Colorado • $523m annual revenue • Major dedicated funds • HR, Technology ($87m) • Facilities ($83m) • General Court Operations • Civil Assessment Fee ($100m) • MOE transition Fund ($163m) • $320 civil filing fee • $102m annual revenue • Major dedicated funds • Court Security ($2.2m) • Judicial Performance ($1m) • Technology ($2.2m) • Judicial Building ($14m) • General Court Operations • Judicial Stabilization Fund ($29m) • $201 civil filing fee
States with Little Program Revenue Virginia Delaware • Major dedicated funds • Court security • No Funds for General Court Operations • $175 civil filing fee • Major dedicated funds • Technology • No Funds for General Court Operations • $204 civil filing fee
National Trends with respect to Program Revenue • Big gap between what courts collect and what courts keep • Program revenue allocated for general use by courts rather than dedicated funds. • More and more court fees, fines and surcharges are used to fund other parts of the justice system with little going to courts • Raising fees, fines and surcharges too high inhibits access to the courts
Need a comprehensive approach to funding the Justice System • The impact of funding one part of the justice system has an impact on other parts • When changes are made in one part of the system the impact on workload needs to be objectively measured to assess the resource requirements in other parts
Comprehensive workload model • Advantages • A consistent methodology ensures reliability in data collection, analyses, and interpretation of results. • Provides a method to identify bottlenecks in the system and concerns regarding current resource levels • Provides data necessary to re-design those processes. • A provides an integrated perspective on workflow and workload • Examples—New Mexico, Maryland, Kentucky