Download
1 / 1
10 likes | 101 Vues
Modeling Effects of Anthropogenic Impact and Climate in the Distribution of Threatened and Endangered Species in Florida. Carolina Speroterra 1 , Laura A. Brandt 2 , David N. Bucklin 1 , Frank J. Mazzotti 1 , Stephanie S. Romañach 3 , James I. Watling 1. Background

E N D
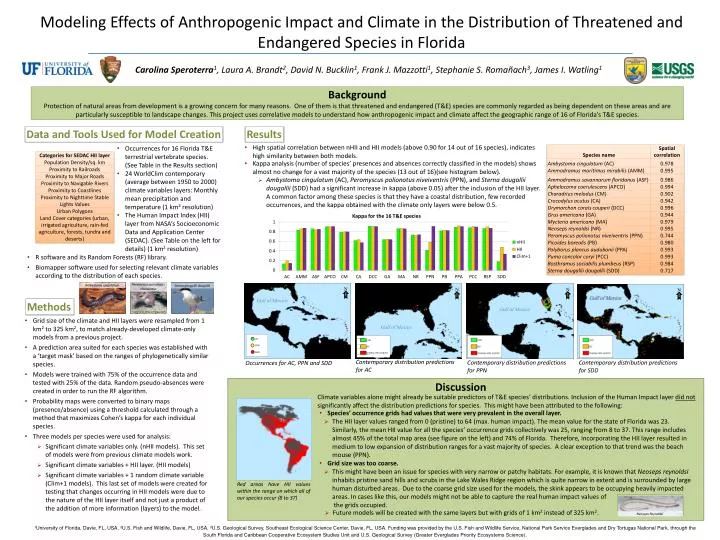
Modeling Effects of Anthropogenic Impact and Climate in the Distribution of Threatened and Endangered Species in Florida Carolina Speroterra1, Laura A. Brandt2, David N. Bucklin1, Frank J. Mazzotti1, Stephanie S. Romañach3, James I. Watling1 Background Protection of natural areas from development is a growing concern for many reasons. One of them is that threatened and endangered (T&E) species are commonly regarded as being dependent on these areas and are particularly susceptible to landscape changes. This project uses correlative models to understand how anthropogenic impact and climate affect the geographic range of 16 of Florida’s T&E species. Results Data and Tools Used for Model Creation • High spatial correlation between nHII and HII models (above 0.90 for 14 out of 16 species), indicates high similarity between both models. • Occurrences for 16 Florida T&E terrestrial vertebrate species. (See Table in the Results section) • 24 WorldClimcontemporary (average between 1950 to 2000) climate variables layers: Monthly mean precipitation and temperature (1 km2 resolution) • The Human Impact Index (HII) layer from NASA’s Socioeconomic Data and Application Center (SEDAC). (See Table on the left for details) (1 km2 resolution) • Kappa analysis (number of species’ presences and absences correctly classified in the models) shows almost no change for a vast majority of the species (13 out of 16)(see histogram below). • Ambystomacingulatum (AC), Peromyscus polionotus niveiventris (PPN), and Sterna dougalliidougallii (SDD) had a significant increase in kappa (above 0.05) after the inclusion of the HII layer. A common factor among these species is that they have a coastal distribution, few recorded occurrences, and the kappa obtained with the climate only layers were below 0.5. • R software and its Random Forests (RF) library. • Biomapper software used for selecting relevant climate variables according to the distribution of each species. Peromyscus polionotus niveiventris Ambystomacingulatum Sterna dougalliidougallii Methods • Grid size of the climate and HII layers were resampled from 1 km2to 325 km2, to match already-developed climate-only models from a previous project. • A prediction area suited for each species was established with a ‘target mask’ based on the ranges of phylogenetically similar species. • Models were trained with 75% of the occurrence data and tested with 25% of the data. Random pseudo-absences were created in order to run the RF algorithm. • Probability maps were converted to binary maps (presence/absence) using a threshold calculated through a method that maximizes Cohen’s kappa for each individual species. • Three models per species were used for analysis: Credit Michael Reidmer Credit Gabriel Lugo Credit Friends of the Archie Carr NWR N N N N Gulf of Mexico Gulf of Mexico Gulf of Mexico Contemporary distribution predictions for AC Contemporary distribution predictions for PPN Contemporary distribution predictions for SDD Occurrences for AC, PPN and SDD Discussion Climate variables alone might already be suitable predictors of T&E species’ distributions. Inclusion of the Human Impact layer did notsignificantly affect the distribution predictions for species. This might have been attributed to the following: • Species’ occurrence grids had values that were very prevalent in the overall layer. • The HII layer values ranged from 0 (pristine) to 64 (max. human impact). The mean value for the state of Florida was 23. Similarly, the mean HII value for all the species’ occurrence grids collectively was 25, ranging from 8 to 37. This range includes almost 45% of the total map area (see figure on the left) and 74% of Florida. Therefore, incorporating the HII layer resulted in medium to low expansion of distribution ranges for a vast majority of species. A clear exception to that trend was the beach mouse (PPN). • Grid size was too coarse. • This might have been an issue for species with very narrow or patchy habitats. For example, it is known that Neosepsreynoldsi inhabits pristine sand hills and scrubs in the Lake Wales Ridge region which is quite narrow in extent and is surrounded by large human disturbed areas. Due to the coarse grid size used for the models, the skink appears to be occupying heavily impacted areas. In cases like this, our models might not be able to capture the real human impact values of • the grids occupied. • Significant climate variables only. (nHIImodels). This set of models were from previous climate models work. • Significant climate variables + HII layer. (HII models) • Significant climate variables + 1 random climate variable (Clim+1 models). This last set of models were created for testing that changes occurring in HII models were due to the nature of the HII layer itself and not just a product of the addition of more information (layers) to the model. Red areas have HII values within the range on which all of our species occur (8 to 37) • Future models will be created with the same layers but with grids of 1 km2 instead of 325 km2. NeosepsReynoldsi 1University of Florida, Davie, FL, USA, 2U.S. Fish and Wildlife, Davie, FL, USA, 3U.S. Geological Survey, Southeast Ecological Science Center, Davie, FL, USA. Funding was provided by the U.S. Fish and Wildlife Service, National Park Service Everglades and Dry Tortugas National Park, through the South Florida and Caribbean Cooperative Ecosystem Studies Unit and U.S. Geological Survey (Greater Everglades Priority Ecosystems Science).