Download
1 / 102
1.22k likes | 1.93k Vues
Irrigation Efficiency and Uniformity. R. Troy Peters, PhD, PE. Average Annual Rainfall. USGS 1995 Consumptive Use Numbers. % Consumptive Use of Renewable Supply. Entire Colorado River Basin 103% California – Nevada 35% Montana – Wyoming – Nebraska 30%

E N D
Irrigation Efficiency and Uniformity R. Troy Peters, PhD, PE
% Consumptive Use of Renewable Supply • Entire Colorado River Basin 103% • California – Nevada 35% • Montana – Wyoming – Nebraska 30% • Entire Mississippi River Basin 9% • Washington – Oregon – Idaho 4% • 80% of WA water withdrawals is for Agriculture • Greater % of consumptive use is irrigation
Washington Irrigation • 1.8M irrigated acres • 80% sprinkler, 15% surface (gravity), 5% drip • 75% surface water, 25% groundwater • Today irrigators apply ¾ the amount of water that they were in the early 1970’s and getting much better yields • Recently (2002) the total sprinkler irrigated acres in the U.S. surpassed surface irrigated acres 2003 Census of Agriculture. Farm and Ranch Irrigation Survey
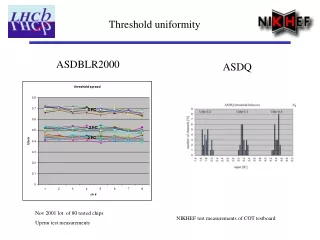
Christiansen Coefficient of Uniformity where: CU = coefficient of uniformity z = individual catch (in) m = average catch (in)
Uniformity • Better yields • Improved crop quality (more uniform) • Less water used = $$ savings • Less lost fertilizers • Less mess • Better for the environment • Chemigate or fertigate with confidence
Improve Uniformity • Run at pressure and flow rate that the sprinkler package was designed for. • Keep correct nozzle sizes in correct position • Keep your sprinkler chart. Double check it. • More sprinkler overlap • closer spacing • larger wetted diameter (sprinkler throw distance) • Replace nozzles every 3-5 years (inexpensive) • Rotator/Wobblers are better, but must be rotating. Fix leaks. Fix and unplug heads.
Center Pivot Uniformity • Replace sprinklers about every 7 years. • Use pressure regulators on sloping fields (depends on operating pressure; > 10-15 ft elevation difference). • Run at the pressure and flow rate specified in the nozzle package. If pressure or flow rate changes, renozzle. • End gun and cornering system uniformity is typically poor.
Irrigating Potatoes • Large yield & quality losses caused by water stress in all stages of development • Deficit irrigating is not economically justified on potatoes. • Large differences in profitability on potato production due solely to irrigation management
Forms of Water Loss • Wind Drift • Droplet Evaporation • Evaporation from Foliage • Evaporation from Soil Surface • Runoff • Deep Percolation • Overwatering • Non Uniformity
Irrigation Efficiencies Highly dependant on: • System Design • Management • Maintenance • Weather • Operating Conditions
Improve Efficiencies By: • Get a good design • Maintain your system • Replace worn nozzles • Fix leaky pipes • Improve management • Irrigation Scheduling • Operate at designed pressure and flow • Irrigate on calm cool days • Increase Application Rate
Why Should I Care? • Even if the water is free, poor irrigation management has very real costs • Yields and quality are very strongly correlated with irrigation water management • Expensive fertilizers washed out • Environmental damage
Marketable YieldsforVariousVegetableCrops cabbage spinach rape carrot tomato onion Imtiyaz, M., N.P. Mgadla, B. Chepete, and S.K. Manase. 2000. Response of six vegetable crops to irrigation schedules. Agricultural Water Management. 45(3):331-342
Over-Irrigating • Increased incidence of plant diseases • Blights, molds, rots, wilts • Reduced storability • Difficulty with harvesting and cultural operations • Less oxygen in root zone, yield loss • Additional labor, pumping, fertilizer costs
Water Costs • Assumptions: • 130 acres • 100 ft deep well • Center Pivot (40 psi required at pump) • 56% irrigation efficiency (85% application efficiency, 30% loss to deep percolation, additional water for poor uniformity) • Growing corn (seasonal water req’d: 36 in) • $0.04/kW-hr • Unnecessary electric power costs paid $3,200 (compared to 80% efficiency)
Pumping Costs • $1.29/acre-in pumping costs • At 80% irrigation efficiency and 85% uniformity $1.90/acre-in of plant water requirements • About $250 to apply 1 inch to a ¼ mile pivot.
Fertilizer Losses • Assume: • silt loam soil (2 in/ft), • growing potatoes, 1.5 ft root zone • at field capacity • even concentration of fertilizer throughout profile and leached water • Over-irrigating 1 inch = about 14% of soluble fertilizers percolated out of the root zone. • Results in lost $, lower yield and potato quality
Benefits • Most things that decrease your irrigation costs also benefit the environment • More flow for fish, less dirty water returning to rivers • Less consumption of energy • Less fertilizer, pesticides in streams and groundwater • More carbon sequestration (takes CO2 out of the air)
But Make Some Real Money! • Saving money small compared to the yield increases and crop quality improvements common from improved irrigation water management.