Download
1 / 1
10 likes | 135 Vues
Sampling depth:. ELECTRICAL RESISTIVITY SOUNDING TO STUDY WATER CONTENT DISTRIBUTION IN HETEROGENEOUS SOILS. A. Bt. Zane Z. Hadzick 1 , Andrey K. Guber 2 , Yakov A. Pachepsky 2 , Robert L. Hill 1 , Randy A. Rowland 2 , Amanda Garzio-Hadzick 1. C.

E N D
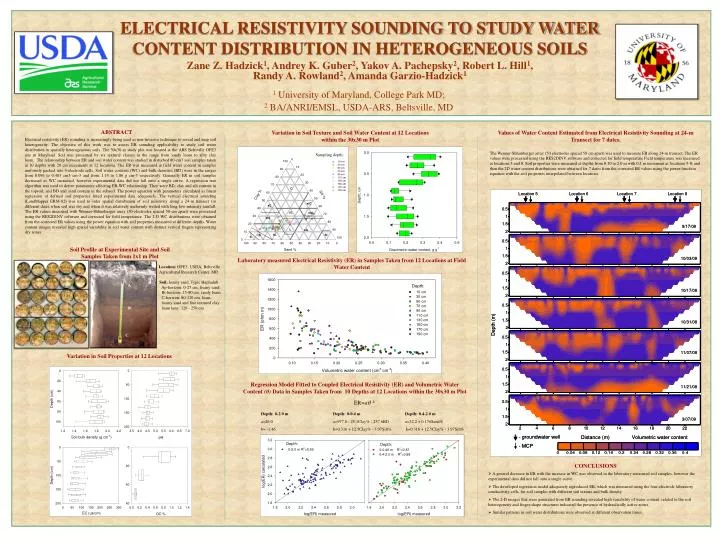
Sampling depth: ELECTRICAL RESISTIVITY SOUNDING TO STUDY WATER CONTENT DISTRIBUTION IN HETEROGENEOUS SOILS A Bt Zane Z. Hadzick1, Andrey K. Guber2, Yakov A. Pachepsky2, Robert L. Hill1, Randy A. Rowland2, Amanda Garzio-Hadzick1 C 1 University of Maryland, College Park MD; 2 BA/ANRI/EMSL, USDA-ARS, Beltsville, MD ABSTRACT Variation in Soil Texture and Soil Water Content at 12 Locations within the 30x30 m Plot Values of Water Content Estimated from Electrical Resistivity Sounding at 24-m Transect for 7 dates. Electrical resistivity (ER) sounding is increasingly being used as non-invasive technique to reveal and map soil heterogeneity. The objective of this work was to assess ER sounding applicability to study soil water distribution in spatially heterogeneous soils. The 30x30-m study plot was located at the ARS Beltsville OPE3 site in Maryland. Soil was presented by six textural classes in the range from sandy loam to silty clay loam. The relationship between ER and soil water content was studied in disturbed 80-cm3 soil samples taken at 10 depths with 20 cm increments at 12 locations. The ER was measured at field water content in samples uniformly packed into 4-electrode cells. Soil water contents (WC) and bulk densities (BD) were in the ranges from 0.096 to 0.403 cm3 cm-3 and from 1.14 to 1.86 g cm-3 respectively. Generally ER in soil samples decreased as WC increased, however experimental data did not fall onto a single curve. A regression tree algorithm was used to derive parameters affecting ER-WC relationship. They were BD, clay and silt content in the topsoil, and BD and sand content in the subsoil. The power equation with parameters calculated as linear regression of defined soil properties fitted experimental data adequately. The vertical electrical sounding (LandMapper ERM-02) was used to infer spatial distribution of soil resistivity along a 24-m transect for different dates when soil was dry and when it was relatively uniformly wetted with long low-intensity rainfall. The ER values measured with Wenner-Shlumberger array (50-electrodes spaced 50-cm apart) were processed using the RES2DINV software and corrected for field temperature. The 2-D WC distributions were obtained from the corrected ER values using the power equation with soil properties measured at different depths. Water content images revealed high spatial variability in soil water content with distinct vertical fingers representing dry zones. The Wenner-Shlumberger array (50 electrodes spaced 50 cm apart) was used to measure ER along 24-m transect. The ER values were processed using the RES2DINV software and corrected for field temperature Field temperature was measured at locations 5 and 8. Soil properties were measured at depths from 0.10 to 2.0 m with 0.1 m increment at locations 5-8, and then the 2D water content distributions were obtained for 7 dates from the corrected ER values using the power function equation with the soil properties interpolated between locations. Soil Profile at Experimental Site and Soil Samples Taken from 1x1 m Plot Laboratory measured Electrical Resistivity (ER) in Samples Taken from 12 Locations at Field Water Content Location: OPE3,USDA, Beltsville Agricultural Research Center, MD Soil: loamysand, Typic Hapludult Ap-horizon: 0-25 cm, loamy sand; Bt-horizon: 25-80 cm, sandy loam; C-horizon: 80-120 cm, loam; loamy sand and fine textured clay loam lens: 120 - 250 cm Variation in Soil Properties at 12 Locations Regression Model Fitted to Coupled Electrical Resistivity (ER) and Volumetric Water Content (θ) Data in Samples Taken from 10 Depths at 12 Locations within the 30x30 m Plot ER=a -b Depth: 0-2.0 mDepth: 0-0.4 m Depth: 0.4-2.0 m a=26.0 a=977.0 - 25.1Clay% - 237.6BD a=32.2 + 0.176Sand% b=-1.46 b=0.316 + 12.5Clay% - 3.97Silt%b=0.316 + 12.5Clay% - 3.97Silt% CONCLUSIONS • A general decrease in ER with the increase in WC was observed in the laboratory-measured soil samples, however the experimental data did not fall onto a single curve. • The developed regression model adequately reproduced ER, which was measured using the four-electrode laboratory conductivity cells, for soil samples with different soil texture and bulk density. • The 2-D images that were generated from ER sounding revealed high variability of water content related to the soil heterogeneity and finger-shape structures indicated the presence of hydraulically active zones. • Similar patterns in soil water distributions were observed at different observation times.