Download
1 / 40
400 likes | 559 Vues
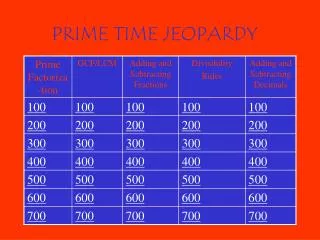
Prime Time. By the numbers… Beth Walsh, PBS Craig Reed, TRAC. Question 1. I'd like to see that five-year trend focusing on GRPS and cumes with a lens on prime time and the NPS. As we see the national numbers continuing to trend downward, what's the thinking at PBS, can it be

E N D
Prime Time By the numbers… Beth Walsh, PBS Craig Reed, TRAC
Question 1 I'd like to see that five-year trend focusing on GRPS and cumes with a lens on prime time and the NPS. As we see the national numbers continuing to trend downward, what's the thinking at PBS, can it be reversed? Leveled? As a corollary, are there local examples of schedules and strategies that have done so?
Average GRPs from Stable Markets Prime Time – minus 5% Whole Day – Minus 14%
WGBH Prime Time Ratings & Cumes Note: Household ratings an average of four major sweeps each year
Over Five Seasons 03-04 to 07-08 Prime Time Percent Change Primary Stations
Household Reach Trend NTI weekly time period cumes, 8 sample weeks per season, PBS Research, 9/2/08.
Theories on the Incredible Shrinking Cume • Lack of station encoding • Fragmenting and digital readiness • Programming decisions / declining corporate support
Question 2 Are Public Affairs programs scheduled on Friday night because they work there or because nothing else will? The commercial stations schedule public affairs programming on weekend mornings, PBS has continued to buck that trend. Is it still the right decision or should we move on?
Ratings Under-Perform vs. HUTs PTV Ratings Indexed to HUTs, Oct 2008
Weekend News AnalysisNetwork Ratings Nielsen Galaxy Explorer, 2007-08.
Question 3 I'd like to know more about pledge erosion (or the effects of pledging often). Does our regular audience fall off after a pledge drive, and if so, by how much? This could also tie in with the CPB research that indicated people wanted a "regular" schedule. What happens when we preempt the "regular" schedule for whatever reason (pledge, NPS stunt)?
Question 4 Why do we continue to see multi-night programming stunts when previous CPB and PBS audience research indicated that it was ineffective. Wouldn't water-cooler talk over 5 weeks be preferable to viewer drop off by the third night of a 5-night stunt? If we have research, we aren't we using the results?
Ongoing and Limited Series Ratings Fall Averages Among Stable Set of Markets
Question 5 I wonder what happens post digital transition.... how will Nielsen deal with the massive confusion, audience disruptions, etc etc? Exactly what are Nielsen's plans for "March '09" sweeps and beyond? Will their info be accurate or relevant after the transition?
Methods Changes are Prep Work • A/P Meter • Encoders • Area Probability Sampling • Reporting of Additional Stations
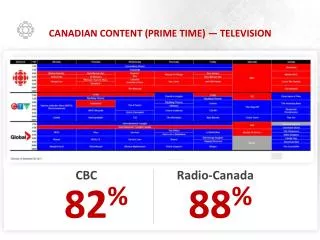
National Measurement Post-Transition • All stations must install a digital encoder • Nielsen will measure one primary digital channel per PBS member station • Recommendation: Stations should designate one primary digital channel that carries the entire NPS schedule – children’s, prime time, late-night, and weekends. • Nielsen will track only those programs fed and encoded by PBS for the feed week • Recommendation: For complete national program ratings, all stations should carry the episode fed by PBS.
National Measurement Post-Transition • All programming must be carried within seven days of the feed from PBS to get credited toward the national program rating. • Recommendation: All stations should observe a broadcast window of seven days from the national feed by PBS. • Nielsen will only incorporate the HD viewing of program if the entire schedule on the HD channel is an exact simulcast of the primary signal • Recommendation: If stations have an HD channel apart from their primary channel, the program schedule should be an exact simulcast.
PBS NSI Rep • Multicast channels measured? • Contact rep now • Calibration, new contract and prep needed • Otherwise Nielsen is ready
Question 6 The one thing I would like to have discussed is how Nielsen is gathering ratings data in terms of repeats, DVR's, VOD, etc. and how it is used by other broadcasters/cable to sell commercial time and how PBS or producing stations are using it in the area of program/series funding.
Live +7 • July ’07 analysis of five stations showed: • Whole day increase of 3% • Prime time at +4% • Most recorded • Prime time, kids, weekend daytime • Also – Britcoms, daytime news
TAMi (Total Audience Measure index) • NBC adding all exposure of shows on 5 platforms • broadcast • Free internet streaming (definition of stream) • Paid downloads • Video on demand • Mobile viewing
TAMi • Heros first episode: • Broadcast – 11.2 million viewers • 3.1 million streams • 15,306 downloads • 5,627 video on demand • 18,306 mobile views
National Nielsen Measures Used • Live, Live+same day, Live+3, Live+7 • C3 – Commercial Minute Rating that includes 3 days of time-shifted viewing • PBS – Seven-day tracking using Live+7 data set • VOD – measured by Nielsen, PBS does not subscribe
Question 7 I'd like some data on LPM markets. How are they faring compared to non-LPM, are rebounds happening for stations, are there any "successful" LPM markets and if so, what are they doing? How do we interpret data in this "apples" and "oranges" world (i.e., do we only compare to other LPM markets or is it still relevant on some level to compare to Portland)? That kind of thing.
‘03-04 LPM Markets: NY, LA, CH, SF Prime Time GRPs
2005-06 LPM Market: Alanta Prime Time GRPs
Question 8 When do we stop talking about ratings (what's the magic number....below a 1 average) and really talk only about being a "public service" media?
Discovery – 15 Channels Discovery Channels – Larger Audiences Note: 05-06 prime time ratings – PTV earned 1.5 that season
Discovery Bubble Chart Older TRAV APL % Age 50+ Younger TLC DISC % Women Men Women
Context is Key • The actual rating is not as important as the relative size • What share keeps us relevant? • Setting expectations post-transition