Download
1 / 32
330 likes | 575 Vues
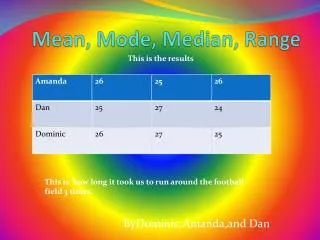
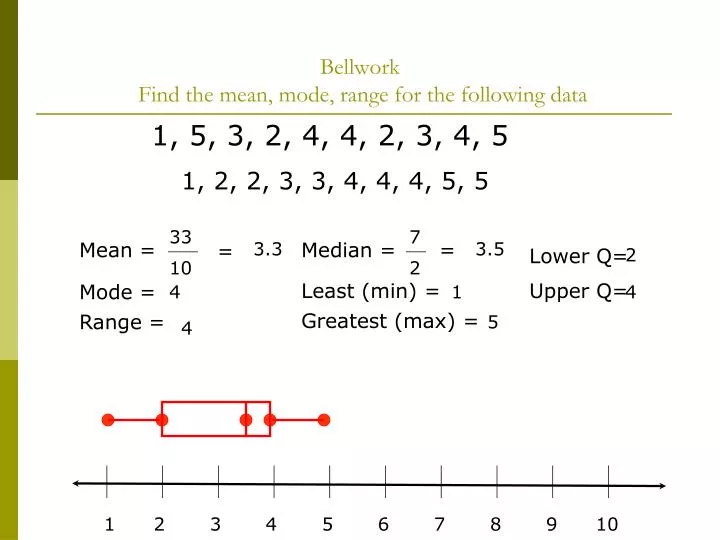
33. 7. 10. 2. Bellwork Find the mean, mode, range for the following data. 1, 5, 3, 2, 4, 4, 2, 3, 4, 5. 1, 2, 2, 3, 3, 4, 4, 4, 5, 5. Mean =. 3.3. Median =. =. 3.5. =. Lower Q=. 2. Least (min) =. Upper Q=. Mode =. 4. 1. 4. Greatest (max) =. Range =. 5. 4.

E N D
33 7 10 2 Bellwork Find the mean, mode, range for the following data 1, 5, 3, 2, 4, 4, 2, 3, 4, 5 1, 2, 2, 3, 3, 4, 4, 4, 5, 5 Mean = 3.3 Median = = 3.5 = Lower Q= 2 Least (min) = Upper Q= Mode = 4 1 4 Greatest (max) = Range = 5 4 1 2 3 4 5 6 7 8 9 10
BOX AND WHISKER REVIEW Use the box-and-whisker plots below to answer each question. Maroon’s Shoe Store Green’s Shoe Store 20 24 26 28 30 32 34 36 38 40 42 44 tNumber of Shoes Sold in One Week at Each Store Which shoe store has a greater median? The median number of shoes sold in one week at Green’s Shoe Store, about 32, is greater than the median number of shoes sold in one week at Maroon’s Shoe Store, about 28.
BOX AND WHISKER Review Use the box-and-whisker plots below to answer each question. Maroon’s Shoe Store Green’s Shoe Store 20 24 26 28 30 32 34 36 38 40 42 44 tNumber of Shoes Sold in One Week at Each Store Which shoe store has a greater interquartile range? Maroon’s shoe store has a longer box, so it has a greater interquartile range.
BOX AND WHISKER Review Use the box-and-whisker plots below to answer each question. Maroon’s Shoe Store Green’s Shoe Store 20 24 26 28 30 32 34 36 38 40 42 44 tNumber of Shoes Sold in One Week at Each Store Which shoe store appears to be more predictable in the number of shoes sold per week? The range and interquartile range are smaller for Green’s Shoe Store, so the number of shoes sold per week is more predictable at. Green’s Shoe Store.
Answer the following questions City A = 460 City B = 450 City A=550-425=125 City B = 475-440=35 City A=600-350=250 City B = 625-350=275
Unit 1 Chapter 7 Section 8 Populations and Samples Pg. 412
EQ: • How do you compare and analyze sampling methods?
Definitions • Population: the entire group of objects or individuals considered for the survey • Sample: part of the population • Random Sample: a sample in which each member of the population has an equal chance of being selected
Definitions continued… • Convenience Sample: sampling the most available subjects in the population to obtain a quick result • biased sample: a sample that does not fairly represent the population
Populations and Samples Video Cliphttp://player.discoveryeducation.com/index.cfm?guidAssetId=D24D0978-BB7A-428E-94D7-855550A56B56&blnFromSearch=1&productcode=US • Write down 3 facts about samples and populations from the video. • Use complete sentences. • 1. • 2. • 3.
Example 1 Determine which sampling method will better represent the entire population. Justify your answer. Convenience sample Random sample Jon’s sample is a random sample, giving every band member equal chance to be surveyed, so it is the better method.
Practice Daria’s survey is better because she has randomly selected customers from the store.
Practice Vonetta’s method is best because she uses a random sample.
Example 2 Determine whether each sample may be biased. Explain. A. The mayor surveys 100 supporters at a rally about the most important issues to be addressed by the city council. The sample is biased. The supporters may have different ideas than those not at the rally. B. The principal sends out questionnaires to all of the students to find out what kind of music students prefer at dances. It is not biased. The sample is random. The students all have a chance to respond.
Practice The sample is random because ever customer has a chance to be picked for the 500. The sample is biased because all city residents may not eat at this restaurant.
Practice The sample is biased because listeners of the station are more likely to enjoy the music the station plays. It is a random sample.
Dry Erase Board ActivityPopulations and Sample ReviewWhich better represents the population? Suki’s method will better represent the school population because uses a random sample. Dinah’s method will produce results that are not as representative of the entire population because she uses a convenience sample.
Populations and Samples Review- Is the sample biased? The sample is not biased because it is a random sample.
Populations and Samples Review- Is the sample biased? The sample is biased. It is likely that not all high school students will choose the same kind of music as those who chosen by those who attended a jazz concert.
Random Sample? yes no no
Biased sample? yes no yes
Biased sample? Yes because different passengers on other flights might feel differently no no Yes because people at a movie might spend more/less then other people in the state
Work Session • Complete the handout titled 7-8 Practice C. • Read each question carefully and make sure you explain your answer. • Take your time.
Closing • 1. When can a sample be biased? • 2. Why is it important to use a random sample when looking at data?
Homework • 7-8 Puzzles, Twisters, and Teasers
Homework • Workbook page 65