Download
1 / 1
10 likes | 130 Vues
*. Department of Applied Physics, University of Twente, Enschede, The Netherlands. Department of Physics, University of Surrey, Guildford, GU2 7XH, UK. S J Doran, K K Koerkamp*, M A Bero, P Jenneson E J Morton and W B Gilboy. Incident X-rays. Approximate level of isosurface.

E N D
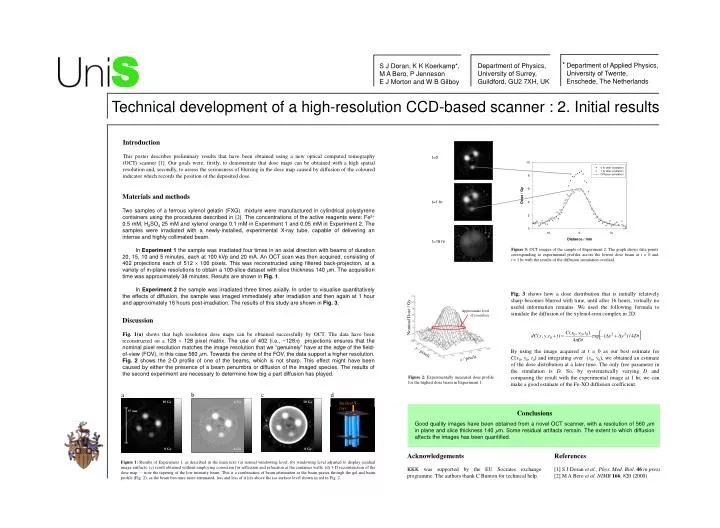
* Department of Applied Physics, University of Twente, Enschede, The Netherlands Department of Physics, University of Surrey, Guildford, GU2 7XH, UK S J Doran, K K Koerkamp*, M A Bero, P Jenneson E J Morton and W B Gilboy Incident X-rays Approximate level of isosurface Nominal Dose / Gy y / pixels x / pixels a b c d 10 Gy 6 Gy 10 Gy 57 mm 0 Gy - 6 Gy 0 Gy S Technical development of a high-resolution CCD-based scanner : 2. Initial results Introduction This poster describes preliminary results that have been obtained using a new optical computed tomography (OCT) scanner [1]. Our goals were, firstly, to demonstrate that dose maps can be obtained with a high spatial resolution and, secondly, to assess the seriousness of blurring in the dose map caused by diffusion of the coloured indicator which records the position of the deposited dose. t=0 Materials and methods Two samples of a ferrous xylenol gelatin (FXG) mixture were manufactured in cylindrical polystyrene containers using the procedures described in [2]. The concentrations of the active reagents were: Fe2+ 0.5 mM, H2SO4 25 mM and xylenol orange 0.1 mM in Experiment 1 and 0.05 mM in Experiment 2. The samples were irradiated with a newly-installed, experimental X-ray tube, capable of delivering an intense and highly collimated beam. In Experiment 1 the sample was irradiated four timesin an axial direction with beams of duration 20, 15, 10 and 5 minutes, each at 100 kVp and 20 mA. An OCT scan was then acquired, consisting of 402 projections each of 512 100 pixels. This was reconstructed using filtered back-projection, at a variety of in-plane resolutions to obtain a 100-slice dataset with slice thickness 140 mm. The acquisition time was approximately 38 minutes. Results are shown in Fig. 1. In Experiment 2 the sample was irradiated three times axially. In order to visualise quantitatively the effects of diffusion, the sample was imaged immediately after irradiation and then again at 1 hour and approximately 16 hours post-irradiation. The results of this study are shown in Fig. 3. t=1 hr t=16 hr Figure 3: OCT images of the sample of Experiment 2. The graph shows data points corresponding to experimental profiles across the lowest dose beam at t = 0 andt = 1 hr with the results of the diffusion simulation overlaid. Fig. 3 shows how a dose distribution that is initially relatively sharp becomes blurred with time, until after 16 hours, virtually no useful information remains. We used the following formula to simulate the diffusion of the xylenol-iron complex in 2D: Discussion Fig. 1(a) shows that high resolution dose maps can be obtained successfully by OCT. The data have been reconstructed on a 128 128 pixel matrix. The use of 402 (i.e., ~128p) projections ensures that the nominal pixel resolution matches the image resolution that we “genuinely” have at the edge of the field-of-view (FOV), in this case 560 mm. Towards the centre of the FOV, the data support a higher resolution. Fig. 2 shows the 2-D profile of one of the beams, which is not sharp. This effect might have been caused by either the presence of a beam penumbra or diffusion of the imaged species. The results of the second experiment are necessary to determine how big a part diffusion has played. By using the image acquired at t = 0 as our best estimate for C(x0, y0, t0) and integrating over (x0, y0), we obtained an estimate of the dose distribution at a later time. The only free parameter in the simulation is D. So, by systematically varying D and comparing the result with the experimental image at 1 hr, we can make a good estimate of the Fe-XO diffusion coefficient. Figure 2: Experimentally measured dose profile for the highest dose beam in Experiment 1. Conclusions Good quality images have been obtained from a novel OCT scanner, with a resolution of 560 mm in plane and slice thickness 140 mm. Some residual artifacts remain. The extent to which diffusion affects the images has been quantified. Acknowledgements KKK was supported by the EU Socrates exchange programme. The authors thank C Bunton for technical help. References [1] S J Doran et al., Phys. Med. Biol. 46 in press [2] M A Bero et al.NIMB 166, 820 (2000) Figure 1:Results of Experiment 1, as described in the main text: (a) normal windowing level; (b) windowing level adjusted to display residual image artifacts; (c) result obtained without employing correction for reflection and refraction at the container walls; (d) 3-D reconstruction of the dose map — note the tapering of the low intensity beam. This is a combination of beam attenuation as the beam passes through the gel and beam profile (Fig. 2); as the beam becomes more attenuated, less and less of it lies above the iso-surface level shown in red in Fig. 2.