Download
1 / 7
70 likes | 210 Vues
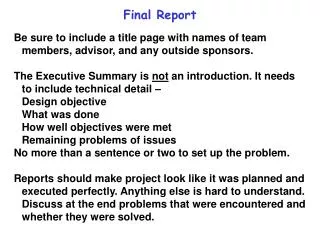
Final Report. Goals and Objectives. PSP Self-review questions. How good is my process ? Where can it be improved ? What is the most important improvement I should make now? What are others doing that works better? How can I learn from them?. How Good Is My Process?.

E N D
Final Report Goals and Objectives
PSP Self-review questions How good is my process? Where can it be improved? What is the most important improvement I should make now? • What are others doing that works better? • How can I learn from them? SE-280Dr. Mark L. Hornick
How Good Is My Process? • Understand your personal process • Productivity (LOC/hr) • Quality (Defects/KLOC) • Review Yield (%) • Cost of Quality (and A/FR) • Size estimating accuracy • Time estimating accuracy • Benchmarks (SE280 PD data) are used to: • Determine steps to improve product quality • Make better plans SE-280Dr. Mark L. Hornick
Over the past few cycles, investigate: • Is productivityimproving? • What can I do to reduce cycle time? • What can I do to reduce Test time? • Quality trend? • Defects/KLOC? A/F ratio? • Improving? How much? • What has changed lately (since Midterm)? • Has there been any improvement? SE-280Dr. Mark L. Hornick
Consolidated data for this course • Compare your own data to that of the charts on the course website • In your report, present your own data alongside and discuss the differences you observe • Explain why your own data may be significantly different from class averages SE-280Dr. Mark L. Hornick
Final Presentations (week 10) • 5-10 minute summary of your process • Key ideas presented in 6-10 ppt slides • Process metrics (Productivity, Size/Time Estimating Accuracy, Defect density, COQ, A/F, etc) • Trends in your data • Explain why your own data may be significantly different from class averages • Future directions for improvement • Present your points graphically SE-280Dr. Mark L. Hornick
Final Presentation submittal Your Powerpointpresentation slides must be committed to your SVN repository by 8:00am the day of your presentation. • In a tag named FinalPres: All final reports must be committed to SVN by 8:00am Friday 2/17 SE-280Dr. Mark L. Hornick