Download
1 / 1

E N D
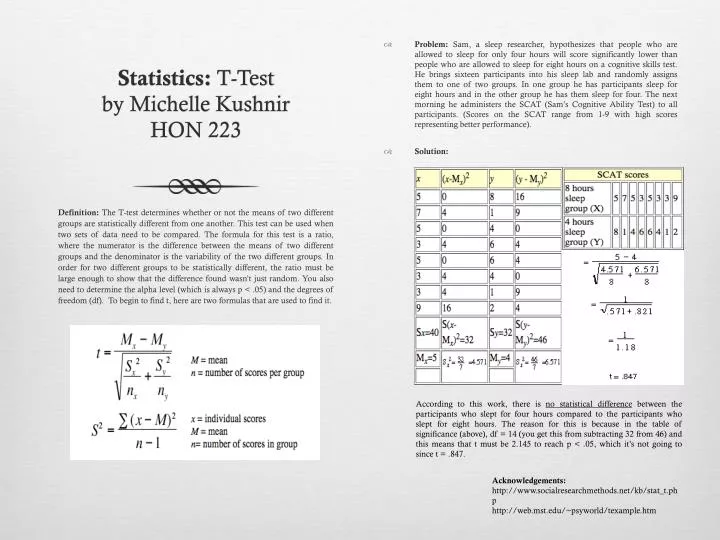
Problem: Sam, a sleep researcher, hypothesizes that people who are allowed to sleep for only four hours will score significantly lower than people who are allowed to sleep for eight hours on a cognitive skills test. He brings sixteen participants into his sleep lab and randomly assigns them to one of two groups. In one group he has participants sleep for eight hours and in the other group he has them sleep for four. The next morning he administers the SCAT (Sam’s Cognitive Ability Test) to all participants. (Scores on the SCAT range from 1-9 with high scores representing better performance). • Solution: Statistics: T-Testby Michelle KushnirHON 223 Definition: The T-test determines whether or not the means of two different groups are statistically different from one another. This test can be used when two sets of data need to be compared. The formula for this test is a ratio, where the numerator is the difference between the means of two different groups and the denominator is the variability of the two different groups. In order for two different groups to be statistically different, the ratio must be large enough to show that the difference found wasn’t just random. You also need to determine the alpha level (which is always p < .05) and the degrees of freedom (df). To begin to find t, here are two formulas that are used to find it. According to this work, there is no statistical difference between the participants who slept for four hours compared to the participants who slept for eight hours. The reason for this is because in the table of significance (above), df = 14 (you get this from subtracting 32 from 46) and this means that t must be 2.145 to reach p < .05, which it’s not going to since t = .847. Acknowledgements: http://www.socialresearchmethods.net/kb/stat_t.php http://web.mst.edu/~psyworld/texample.htm