Download
1 / 2
20 likes | 100 Vues
Data Storage. Cellular Radio. GPS Unit. GT - Trip Data Collector. GT Server. GPS Satellite. Cellular Network. Profile Data. 386 Linux computer 12V Power, 3mA draw Ignition Sensor Vehicle Speed Sensor Global Positioning System Onboard Diagnostics (OBD) Connection

E N D
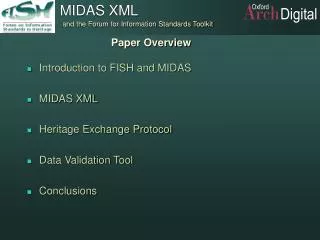
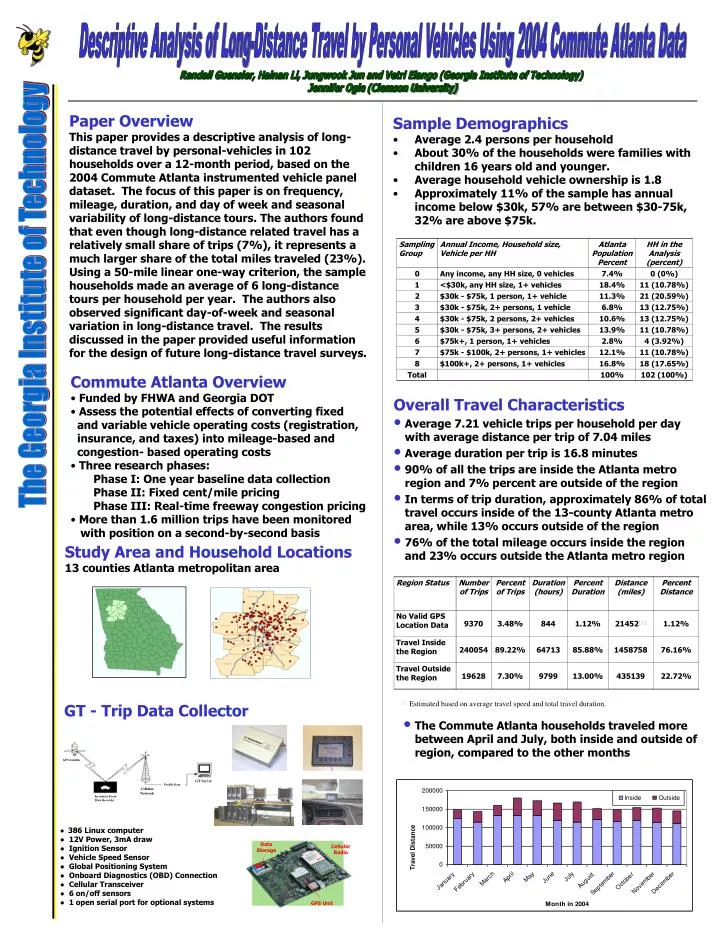
Data Storage Cellular Radio GPS Unit GT - Trip Data Collector GT Server GPS Satellite CellularNetwork Profile Data • 386 Linux computer • 12V Power, 3mA draw • Ignition Sensor • Vehicle Speed Sensor • Global Positioning System • Onboard Diagnostics (OBD) Connection • Cellular Transceiver • 6 on/off sensors • 1 open serial port for optional systems In-vehicle Event Data Recorder Descriptive Analysis of Long-Distance Travel by Personal Vehicles Using 2004 Commute Atlanta Data Randall Guensler, Hainan Li, Jungwook Jun and Vetri Elango (Georgia Institute of Technology) Jennifer Ogle (Clemson University) Paper Overview This paper provides a descriptive analysis of long-distance travel by personal-vehicles in 102 households over a 12-month period, based on the 2004 Commute Atlanta instrumented vehicle panel dataset. The focus of this paper is on frequency, mileage, duration, and day of week and seasonal variability of long-distance tours. The authors found that even though long-distance related travel has a relatively small share of trips (7%), it represents a much larger share of the total miles traveled (23%). Using a 50-mile linear one-way criterion, the sample households made an average of 6 long-distance tours per household per year. The authors also observed significant day-of-week and seasonal variation in long-distance travel. The results discussed in the paper provided useful information for the design of future long-distance travel surveys. • Sample Demographics • Average 2.4 persons per household • About 30% of the households were families with children 16 years old and younger. • Average household vehicle ownership is 1.8 • Approximately 11% of the sample has annual income below $30k, 57% are between $30-75k, 32% are above $75k. • Commute Atlanta Overview • Funded by FHWA and Georgia DOT • Assess the potential effects of converting fixed and variable vehicle operating costs (registration, insurance, and taxes) into mileage-based and congestion- based operating costs • Three research phases: Phase I: One year baseline data collection Phase II: Fixed cent/mile pricing Phase III: Real-time freeway congestion pricing • More than 1.6 million trips have been monitored with position on a second-by-second basis • Overall Travel Characteristics • Average 7.21 vehicle trips per household per day with average distance per trip of 7.04 miles • Average duration per trip is 16.8 minutes • 90% of all the trips are inside the Atlanta metro region and 7% percent are outside of the region • In terms of trip duration, approximately 86% of total travel occurs inside of the 13-county Atlanta metro area, while 13% occurs outside of the region • 76% of the total mileage occurs inside the region and 23% occurs outside the Atlanta metro region Study Area and Household Locations 13 counties Atlanta metropolitan area [1] Estimated based on average travel speed and total travel duration. • The Commute Atlanta households traveled more between April and July, both inside and outside of region, compared to the other months
Tour Summary: Start Date: 2004/03/05 End Date: 2004/03/06 Duration: 2 days Number of Trips: 18 Tour VMT: 1200.75 mile Linear Distance: 372.50 mile Household Information: Number of Person: 1 Number of Vehicles: 1 Number of Kids < 16: 0 Income: $50-59k Driver Information: Age: 53 Gender: Female Work Status: Full time Education Level: Bachelors Vehicle Information: Make: Honda Model: CR-V EX Model Year: 2003 Descriptive Analysis of Long-Distance Travel by Personal Vehicles Using 2004 Commute Atlanta Data • Long Distance Tours • Long-distance travel by personal vehicles of 102 households over a period of 12 months • A total of 617 long-distance tours using a 50-mile linear distance criterion • A total of 357 long-distance tours using a 100-mile linear distance criterion • Tour Duration and Day-of-Week Variation • By increasing the minimum linear distance from 50 to 100 miles, 75% percent of the single-day tours without overnight stays were eliminated and approximately 50% percent of the tours with one overnight stay were eliminated (tours of 4 or more days were not impacted) • A large percent (70%) of tours with one or two overnight stays began either on Friday or Saturday and ended on Sunday 50-mile linear distance 50-mile linear distance 100-mile linear distance 100-mile linear distance • Tour Frequency • Based on the 50-mile criterion, sample households made an average of 6 long-distance tours per year and 19 (19%) households did not make any long-distance tours • Based on the 100-mile criterion, sample households made an average of 3.5 long distance tours per year and 28 (27%) did not make any long-distance tours • Tour Seasonal Variation • A strong seasonal pattern was observed in long-distance travel, with the months from April to July having higher numbers of long-distance tours compared to the other months • Tour Distance • Approximately 42% of the long-distance tours are between 50-100 miles away from home, and those tours account for 17% of the long distance VMT • Approximately 58% of the long-distance tours are more than 100 miles away from home, accounting for 83% of the total long-distance VMT • Conclusions • Although long-distance trip making has a relatively small share of all trips, it represents a much larger share of the total miles traveled, and therefore contributes significantly to the economic and environmental impacts of travel • Different distance criteria and calculation methods have strong impact on how many travel and what kind of travel will be captured • The benefits of using instrumented vehicles to collect long-distance travel information are significant and numerous • Future studies combining field observation of travel behavior and survey methods to record the traveler’s decision making process can provide more insight of long-distance travel behavior