Download
1 / 34
380 likes | 788 Vues
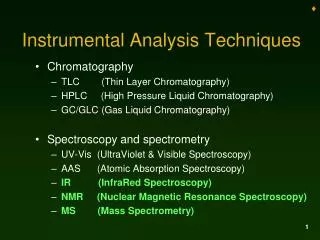
Chromatography TLC (Thin Layer Chromatography) HPLC (High Pressure Liquid Chromatography) GC/GLC (Gas Liquid Chromatography) Spectroscopy and spectrometry UV-Vis (UltraViolet & Visible Spectroscopy) AAS (Atomic Absorption Spectroscopy) IR (InfraRed Spectroscopy)

E N D
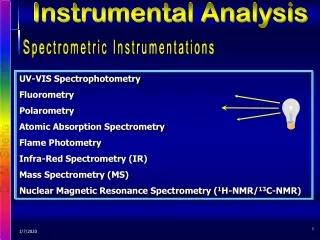
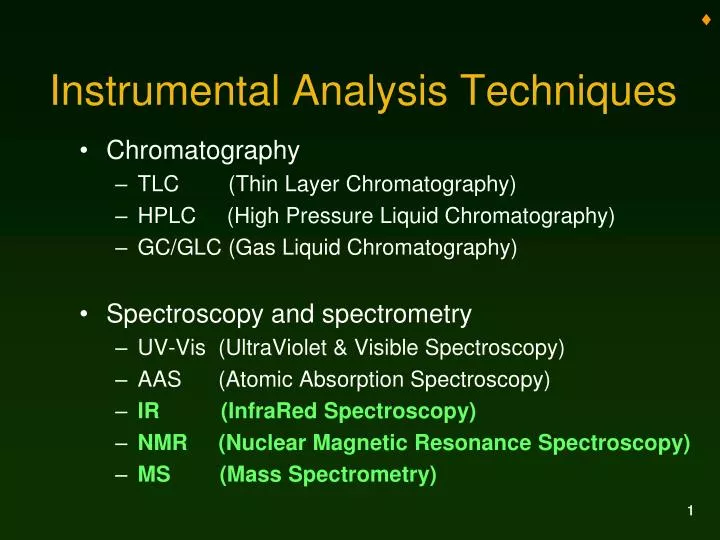
Chromatography TLC (Thin Layer Chromatography) HPLC (High Pressure Liquid Chromatography) GC/GLC (Gas Liquid Chromatography) Spectroscopy and spectrometry UV-Vis (UltraViolet & Visible Spectroscopy) AAS (Atomic Absorption Spectroscopy) IR (InfraRed Spectroscopy) NMR (Nuclear Magnetic Resonance Spectroscopy) MS (Mass Spectrometry) Instrumental Analysis Techniques 1
InfraRed Spectroscopy (IR) • Used to identify types of bonds and functional groups • Specific energy in infrared region is absorbed by different types of bonds as they change vibrational statesie stretching or bending • Data Book Table 7 lists key absorbances of IR radiation • X-axes is measured in wavenumbers (cm-1) and the scale usually runs from 4000 cm-1 to 400 cm-1 • The region below 1400 cm-1 is known as “fingerprint region” and can uniquely identify a compound • Y-axes is usually measured in % transmittance 2
Fingerprint region IR Spectrum • Each ‘peak’ represents a different bond type absorbing IR energy • Full interpretation of every peak will NOT be asked • IR can only be used to uniquely identify a compound if an IR library is used for comparison 3
IR Spectrum – Key peaks C=O (carbonyl) of an ester or carboxylic acid O-H of an alcohol O-H of a carboxylic acid 4 SDBSWeb : http://riodb01.ibase.aist.go.jp/sdbs/ (National Institute of Advanced Industrial Science and Technology, Date of access May ‘08
IR Spectroscopy Sample Q11 Which one of the following compounds will show an absorption band in the infrared spectrum at about 3500 cm-1 A. B. C. D. Data Book Table 7, p7 5
Nuclear Magnetic Resonance Spectroscopy (NMR) • Used to identify chemical environment of either hydrogens or carbons - can give clues to structure • Radio wave energy causes nuclei of 1H or 13C atoms to ‘flip’ spin states • Data Book Tables 5 + 6 lists chemical shifts of1H or 13C atoms caused by radio waves • X-axes of NMR spectrum measured in ppmrelative to an internal standard, tetramethyl silane (TMS), which produces a peak at 0 ppm • Y-axes is usually not given a scale 6
1H NMR Spectrum 13C NMR Spectrum 1H NMR Spectrum 7
Interpreting 1H NMR Spectra Number of peak regions Number of different 1H environments • Four key pieces of information on 1H NMRspectrum Splitting pattern of peak regions Number of adjacent 1H in different environments (n+1 rule) Location of peak regions Nearby atoms influencing 1H - causing chemical shiftof peak region Ratio of areas under peak regions Number of 1H present in a particular environment 8
Interpreting 1H NMR Spectra Two peak regions mean only two hydrogen environments present Integration ratio of 2:3 so 2Hs causing left peak region and 3Hs causing right peak region Molecular formula = C2H5Cl 3H 2H TMS Peak region split into four (quartet, n+1) so these two hydrogens are next to 3 other hydrogens [n=3] Peak region split into three (triplet, n+1) so these three hydrogens are next to 2 other hydrogens [n=2] Chemical shift from Data Book 9
Interpreting 13C NMR Spectra • Same as for 1H NMR except: • Peak regions never split • Chemical shifts are different • Ratio of 13C atoms not possible 10
13C NMR spectroscopy Sample Q12 The structures of the two amino acids, glycine and alanine are shown below. glycine alanine The 13C NMR spectra can be used to uniquely identify each amino acid. Glycine and alanine will produce 13C NMR spectra with the following number of peaks. A. 1 and 2 B. 2 and 2 C. 2 and 3 D. 3 and 3 11
Mass Spectrometry (MS) 12 Technique does not involve absorption of energy Used to identify: • molecular mass of organic compounds (M+) • possible structure of compounds (base peak and other fragments) • isotopic abundance of elements Generates cations (atoms or molecules) Sorts cations on basis of different mass to charge ratio - m/z ratio, using magnetic field Y-axes on mass spectrum written as relative intensity or abundance of cation The X-axes measures m/z ratio
MS - Instrumental set-up Image sourced from Heinemann 2 Commons et al. 3ed 13
MS – Ionisation equations Example – Show the reaction for ionisation of methane Two valid equations CH4(g) + e- → CH4+(g) + 2e- or CH4(g) → CH4+(g) + e- Note :- Electrons are always shown with no states e- 14 14
Interpreting Mass Spectra Base peak The most stable cation formed M+ peak The relative mass of the original molecule 15 15 Charged organic molecules fragment into smaller species Each peak represents detected fragment with specific m/z SDBSWeb : http://riodb01.ibase.aist.go.jp/sdbs/ (National Institute of Advanced Industrial Science and Technology, date of access May ‘08) `
Interpreting Mass Spectra 16 M+ ion (parent ion) gives relative mass of compound Fragmentation produces BOTH • charged cation fragment (detected) and • uncharged fragment (lost / undetected)
Interpreting Mass Spectra Sample Q13 Determine the fragment that must have been lost from the molecular ion to account for the peak at m/z = 31 Peak at m/z = 31 Difference in mass units = 15 fragment lost is CH3 M+ peak 17 m/z difference between peaks shows size of fragment lost
Overview of instruments Sort these correctly Vis UV-Vis Infra red Radio wave Radio wave UV-Vis 13C NMR TLC GC HPLC Mass spec AAS 1H NMR IR 18
Unit 3 AoS 2- Organic chemical pathways • Naming organic molecules • Understanding organic reactions • addition, substitution, oxidation, condensation • Fractional distillation • Biomolecules – reactions and uses • formation, hydrolysis, identification of functional groups • Lipids (triglycerides), biodiesel • Carbohydrates, bioethanol • Proteins, 1, 2, 3 structure, enzymes, protein markers • DNA, gel electrophoresis, applications for forensics 19
Biodiesel • Biofuel manufactured from triglycerides in plants i.e. vegetable oils • Ideally carbon neutral fuel • Triglycerides hydrolysed with KOH into glycerol and fatty acids • Fatty acids then converted into methyl ester biodiesel by reaction with methanol • Issues - land needed to grow plants to produce vegetable oils which could be used for food crops 20
Bioethanol • Biofuel manufactured from carbohydrates (sugars and starch) in plants • Ideally carbon neutral fuel • Sugars fermented to produce 10% – 20% (v/v) ethanol C6H12O6(aq) 2CH3CH2OH(aq) + 2CO2(g) • Product distilled to produce 95% ethanol, dried to produce final product which is 99.7% pure • 5% petrol added to ‘poison’ the “pure” alcohol – foul taste • Issues - land needed to grow plants to produce sugar cane which could be used for food crops yeast enzymes 21
Protein markers • The body can release particular proteins as a result of • Disease • Heart attack • Monitoring and assaying for proteins can therefore allow detection of these conditions Extract from VCAA June 2008 22
Using protein markers of disease to rationally design new drugs 23
DNA • DNA – deoxyribonucleic acid • genetic map of all living things • contains elements C, H, N, O and P • polymer made from nucleotide monomers • each nucleotide made from • phosphate group • sugar (deoxyribose in DNA) • base (adenine, thymine, guanine or cytosine) (A) (T) (G) (C) (Structures are found in VCE Data Book Table 10) 24
DNA – component molecules 25
Formation of DNA Formation of a single molecule of DNA involves linking nucleotides via condensation reactions Hydrolysis of DNA requires one water molecule to separate each nucleotide from a strand Start of a DNA strand nucleotide 26
Formation of DNA double helix • When DNA double helix formed, nitrogeneous bases on each strand base pair up in specific way • Complementary base pairs are A = T and G C Note - A = T link is weaker than G C link guanine and cytosine have three hydrogen bonds between the bases adenine and thymine have two hydrogen bonds between the bases 27
Formation of DNA double helix thymine adenine phosphate units guanine cytosine sugar 28
Formation of DNA double helix • Double strand is often represented in simplified form as: 29
DNA Analysis • Analysis of DNA is commonly performed by chopping up DNA using restriction enzymes and usingGel electrophoresis to identify fragments • DNA fragments are all negatively charged due to phosphate group in DNA • Size of fragments commonly measured in kb(ie 1000’s of bases) • E.g. a fragment which is 6.4 kb is made up of 6400 bases in length • In forensics, a pattern of fragments from a sample can be compared with those from a suspect 30
31
Direction of fragment movement Gel Electrophoresis -ve charge applied • negatively charged fragments move to the positive end of the gel • smaller and more highly charged fragments move faster +ve charge applied Reference materials used as basis of size comparison 32
Sample Q On the diagram shown below, draw in the bonds that form between adenine and thymine base pair as they would exist in the DNA double helix, and then identify the type of bonding you have drawn. The type of bonding formed between bases is hydrogen bonding 33
Sample Q A piece of double stranded DNA, which is known to have 100 base pairs, is found to contains 40 cytosine bases. Determine the number of adenine bases in this piece of DNA. If the DNA has 100 base pairs the DNA must have a total of 200 bases present. If 40 are cytosine bases, there must also be 40 guanine bases. Together, giving 80 G and C bases out of the 200 total present. The remaining 120 bases must be the A -T pairs, which means there would be 60 or each. Answer – There are 60 adenine bases present in this fragment. 34