Download

1 / 31
350 likes | 565 Vues
Framework of Analysis. Fundamental Analysis Approach to Fundamental Analysis: Domestic and global economic analysis Industry analysis Company analysis Why use the top-down approach?. Global Economic Considerations. Performance in countries and regions is highly variable. Political risk

E N D
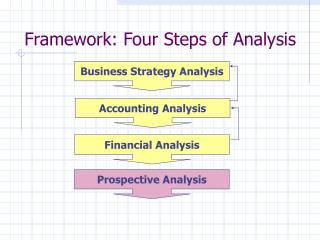
Framework of Analysis • Fundamental Analysis • Approach to Fundamental Analysis: • Domestic and global economic analysis • Industry analysis • Company analysis • Why use the top-down approach?
Global Economic Considerations • Performance in countries and regions is highly variable. • Political risk • Exchange rate risk • Sales • Profits • Stock returns
Table 17.1 Economic Performance in Selected Emerging Markets
Figure 17.1 Change in Real Exchange Rate: Dollar versus Major Currencies, 1999 – 2005
Key Economic Variables • Gross domestic product • Unemployment rates • Interest rates & inflation • Budget deficit • Consumer sentiment
Figure 17.2 S&P 500 Index versus Earnings Per Share Estimate
Demand Shocks • Demand shock - an event that affects demand for goods and services in the economy. • Tax rate cut • Increases in government spending
Supply Shocks • Supply shock - an event that influences production capacity or production costs. • Commodity price changes • Educational level of economic participants
Federal Government Policy • Fiscal Policy - government spending and taxing actions. • Direct policy • Slowly implemented
Federal Government Policy (cont’d) • Monetary Policy- manipulation of the money supply to influence economic activity. • Initial & feedback effects • Tools of monetary policy • Open market operations • Discount rate • Reserve requirements • Supply Side Policies
NBER Cyclical Indicators: Leading Leading Indicators - tend to rise and fall in advance of the economy. Examples: • Avg. weekly hours of production workers • Stock Prices
NBER Cyclical Indicators: Coincident Coincident Indicators - indicators that tend to change directly with the economy. Examples: • Industrial production • Manufacturing and trade sales
NBER Cyclical Indicators: Lagging Lagging Indicators - indicators that tend to follow the lag economic performance. Examples: • Ratio of trade inventories to sales • Ratio of consumer installment credit outstanding to personal income
Figure 17.4 Indexes of Leading, Coincident, and Lagging Indicators
Industry Analysis • Sensitivity to business cycles • Factors affecting sensitivity of earnings to business cycles: • Sensitivity of sales of the firm’s product to the business cycles • Operating leverage • Financial leverage • Industry life cycles
Table 17.6 Operating Leverage of Firms A and B Throughout the Business Cycle
Industry Life Cycles StageSales Growth Start-up Rapid & Increasing Consolidation Stable Maturity Slowing Relative Decline Minimal or Negative
Sector Rotation • Portfolio is adjusted by selecting companies that should perform well for the stage of the business cycle • Peaks – natural resource extraction firms • Contraction – defensive industries such as pharmaceuticals and food • Trough – capital goods industries • Expansion – cyclical industries such as consumer durables