Download
1 / 43
440 likes | 777 Vues
CLIA Waiver Guidance . Carol C. Benson 1 and Marina V. Kondratovich 2 1 Associate Director, Division of Chemistry and Toxicology Devices, OIVD, CDRH, FDA 2 Statistician, Division of Biostatistics, OSB, CDRH, FDA AMDM 33 rd Annual Meeting,

E N D
CLIA Waiver Guidance Carol C. Benson1 and Marina V. Kondratovich2 1 Associate Director, Division of Chemistry and Toxicology Devices, OIVD, CDRH, FDA 2 Statistician, Division of Biostatistics, OSB, CDRH, FDA AMDM 33rd Annual Meeting, April 20, 2006
CLIA Waiver Highlights • Number of test systems categorized • History of the path to CLIA waiver • Consensus guidance – new thoughts on waiver approaches • Next steps
History of the Path to Waiver • Sept. 1995 CDC/CMS proposed rule • Nov. 1997 FDA modernization act • March 2001 FDA Draft Guidance Document (Not Implemented) • Sept. 2005 FDA Draft Guidance Document
42 U.S.C. Section 263a(d)(3) “simple laboratory examinations and procedures that have been approved by the FDA for home use or that…are simple laboratory examinations and procedures that have an insignificant risk of an erroneous result”
42 U.S.C. Section 263a(d)(3) “including those that – (A) employ methodologies that are so simple and accurate as to render the likelihood of erroneous results by the user negligible, or (b) …pose no unreasonable risk of harm to the patient if performed incorrectly”
2005 Consensus Draft Guidance • FDA interpretation law • CLIAC, AdvaMed, CDC and CMS • More flexible • Scientifically based flex studies • Emphasis on use of QC procedures • Emphasis on intended users and patient specimens over time
Demonstrating “Simple” • Fully automated instrument or unitized test system • Uses direct unprocessed samples • Non technique dependent specimen or reagent manipulation
Demonstrating “Simple” - 2 • No operator intervention • No technical or specialized training • Clear labeling – PI with procedure steps at 7th grade • Quick reference instructions
Demonstrating “Insignificant Risk of Erroneous Result” • Tier 1 Hazard Analysis • Tier 2 Fail-Safe and Failure Alert Mechanisms • “Accuracy” - traceability
Tier 1: Hazard Analysis • Operator error/human factors • Specimen handling and integrity • Reagent integrity • Hardware, software and electronics integrity • System stability • Environmental factors
Tier 2 – Fail Safe and Failure Alert Mechanisms • General recommendations in designing • External quality control • Additional points for control materials – stability and reproducibility • Validating Fail Safe/Failure Alert and ext controls – stress system
Demonstrating “Insignificant Risk of Erroneous Result” - “Accuracy” • The term “accurate” tests refers to those tests that are comparable to traceable methods. • Prospective clinical studies of the device proposed for waiver: - intended clinical testing sites; - intended operators; - intended sample type and matrix whenever possible; - testing over time, as in typical intended use setting.
Demonstrating “Accuracy” The clinical studies should compare results obtained with the device proposed for CLIA Waiver (WM) to results obtained by Comparative Method (CM). The CM for the clinical study should be performed in laboratory setting by laboratory professionals.
Demonstrating “Insignificant Risk of Erroneous Result” “Accuracy” • Clinical study sites • Clinical study participants • Clinical samples • Instructions for use - labeling • Questionnaire • Financial disclosure
Labeling for Waived Devices • Quick reference instructions for use • QC recommendations • Educational information – GLP guidelines • Safeguards – MedWatch information on medical products reporting program
Demonstrating “Insignificant Risk of Erroneous Result” – “Accuracy”
Demonstrating “Accuracy” -Quantitative • Selection of Comparative Method (CM): Type A – Reference Method; Type B – Traceable method (measurement values with the same degree of trueness as reference method or reference materials; Type C – Traceable method (measurement values with small systematic bias, which may be clinically tolerable).
Demonstrating “Accuracy” – Quantitative Study Design Example • WM –assay measuring some analyte; Measuring range = (5 units to 800 units); Medically important point = 200 units; • Specimen type for WM – fingerstick blood Patient PAIRED study design Fingerstick blood Venous blood WM CM
Demonstrating “Accuracy” – Quantitative Study Design • 3 sites • 3 intended users (operators) at each site (total number of operators = 9); • 360 samples equally distributed among operators (120 samples per site); • Samples span the measuring range of the device and adequately represent all possible values of CM; • Most of the samples are patient samples (60 spiked); • Patient samples collected not less than 2 weeks
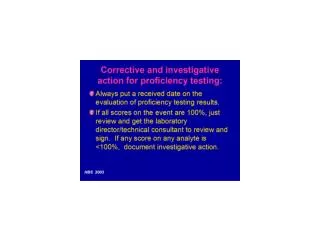
Demonstrating “Accuracy” – Statistical Analysis (Quantitative) Descriptive Statistics • For each site separately and combined: • Scatter plot; • For CM and WM: number results, mean, standard deviation, minimum, maximum, median, box-and-whiskers plot
Demonstrating “Accuracy” – Statistical Analysis (Quantitative) Regression Analysis (CLSI EP9) • Appropriate type of • regression; • example: Deming regression • Slope with 95% CI; • example: slope = 1.02 with • 95% CI: (0.983 to 1.054) • Intercept with 95% CI; • example: intercept = -2.0 with • 95% CI: -11.7 to 7.7)
Demonstrating “Accuracy” – Statistical Analysis (Quantitative) Regression Analysis Using regression equation, calculate the systematic bias (with 95% CI) at medically important points. Example: Y=1.02 *X -2.0 ; Xm = 200; systematic bias at Xm = (1.02 * 200 -2.0) – 200 = 2 units or 1% • Some public comments: • No criteria for slope and intercept; • Only bias at medically important point (not slope close to 1 and intercept close to 0); • No need for regression analysis.
Demonstrating “Accuracy” – Statistical Analysis (Quantitative) Total Analytical Error (CLSI EP21) Total error is a simple metric for all error sources. Error = deviation from truth = Result of WM – Result of CM CM may be an average of replicates
Demonstrating “Accuracy” – Statistical Analysis (Quantitative) Total Analytical Error • Total Error– an interval that contains a specified proportion (usually 95% ) of the distribution of differences between the values of measurement and true value. • Estimation of total error (CLSI EP21-A). • Assumption: at some range of analyte, the errors (absolute • or relative) are identically distributed independent variables. • Errors: E1, E2, E3, …., EN • total error – interval with 2.5th and 97.5th percentiles; • RECOMMENDED SAMPLE SIZE =120 • (for more details about why 120, see CLSI C28)
Demonstrating “Accuracy” – Statistical Analysis (Quantitative) Total Analytical Error • 9 measurements • Observed ordered differences between WM and CM • -5, -2, -2, 0, 0, +1, +1, +3, +4 • 60%-total analytical error ???? • 20th percentile = -2 • 80th percentile = +3 • 60%-total analytical error is (-2 to +3) • 2.5th and 97.5th percentiles; • RECOMMENDED SAMPLE SIZE =120 • (for more details about why 120, see CLSI C28)
Demonstrating “Accuracy” – Statistical Analysis (Quantitative) Total Analytical Error 97.5th percentile 2.5th percentile
Demonstrating “Accuracy” – Statistical Analysis (Quantitative) Total Analytical Error • Divide the measuring range for three medically relevant intervals; • For each interval calculate the total analytical error. • Some Public Comments: • Sample size of 360 is “too burdensome”; • Sample size is not enough ( it should be at least 6 sites and 720 samples); • Larger number of contrived samples.
Quantitative Performance Criteria • Establish Allowable Total Error (ATE) (for 95% of differences for WM and CM): values of WM that fall within ATE zones are values that can be tolerated without invalidating the medical usefulness of the WM results. • Establish Limits for Erroneous Results (LER) (no observations in LER): when WM values fall within LER zones, potential harm can occur to the patients if these results are utilized in medical decision making.
Allowable Total Error, Zones of Limits for Erroneous Results Allowable Total Error (at least 95% of subjects) Zones of Limits for Erroneous Results (0% of subjects). For 360 samples, upper limit of 95% CI is less than 1%.
Quantitative Performance Criteria • For analytes that have existing performance limits for professional use, these limits should be used (CLIA, 42CFR 493.929) Allowable percent is not more than 20%; It can be different rules for defining the ATE zones for different ranges of CM Example of ATE: if CM>90 units, CM ± 20%*CM; if 5≤CM≤90, CM ± 18 units
Quantitative Performance Criteria • For analytes not listed in the CLIA regulations, other criteria may be acceptable (consult with OIVD) ATE and LER zones could be based on • medical decision making, • consideration of biological variations of analyte, • needs for accuracy of the samples within the reference intervals or • other scientific approaches.
Demonstrating “Accuracy” – Qualitative Study Design • Selection of comparative method: type A – quantitative reference method; type B – quantitative traceable of type B; type C – quantitative traceable of type C; type D –qualitative reference method; type E – qualitative method which was tested by reference specimen panels (e.g, panels prepared by WHO, CDC, NIST).
Demonstrating “Accuracy” – Qualitative Study Design • 3 or more clinical sites and intended users (9) • 120 samples positive by CM 120 samples negative by CM Prospective patient samples, archival, contrived matrix-specific. • Each sample split (or pair of samples): one part for test system (WM) and other part for comparator method (CM).
Demonstrating “Accuracy” – Qualitative Statistical Analysis Positive and negative agreements between WM and CM (95% two-sided CI) – for every site and combined Pos. Agreement = 95.8% (115/120) with low limit of 95% two-sided CI of 90.5%; Neg. Agreement = 98.3% (118/120) with low limit of 95% two-sided CI of 94.1%.
Qualitative Performance Criteria, I • Positive and negative agreements between WM and CM should be not less than 95% (for some analytes, can be higher) • Some Public Comments : • Too strong requirements for sensitivity and specificity of WM; • 120 samples positive by CM is “too burdensome”.
Demonstrating “Accuracy” – Qualitative Study Design Near Cutoff Studies
Demonstrating “Accuracy” – Qualitative Study Design Near Cutoff Studies Weak Positive concentration is a concentration above the cutoff that the test yields positive results 95% of the time. Weak Negative concentration is a concentration below the cutoff that the test yields negative results 95% of the time. The length of 95% interval near the cutoff is very important analytical characteristics of the qualitative method.
Demonstrating “Accuracy” – Qualitative Study Design Near Cutoff Studies • Prepare 60 aliquots of one sample with Weak Positive concentration (CM get positive results 95-99%); • Prepare 60 aliquots of one sample with Weak Negative concentration (CM get negative results 95-99%); • Select 3 intended use sites; • Test 20 samples of each type at each testing • site.
Demonstrating “Accuracy” – Qualitative Statistical Analysis Near Cutoff Studies Statistical analysis Percent of positive results for weak positive sample (for every site and combined); Percent of negative results for weak negative sample (for every site and combined).
Qualitative Performance Criteria, II Near Cutoff Studies • The percent of positive results for the weak positive sample should be close to 95%; • The differences in percents of the positive results among 3 sites for the weak positive sample should not be clinically or statistically significant . • Similar for weak negative sample
Some Comments on Entire Guidance • “…This is a tremendous guideline. One simple comment is that it could be envisioned to apply to all diagnostic assays, not just waiver assays.” • “This draft Guidance must be withdrawn… The “accuracy” study for waiver should only be required to demonstrate that the waived user can operate the device as well as a professional user.” “Agreement studies” in 2001 FDA Guidance.
Plan Forward • Draft guidance - solicit comments • Revise draft to final guidance • Issue proposed rule • Issue final rule