Download
1 / 56
570 likes | 756 Vues
Galaxy Structure, Galaxy Clusters, Large Scale Structure, Hubble ’ s Law and the Distance Ladder. Astronomy 100. The “ Discovery ” of Galaxies.

E N D
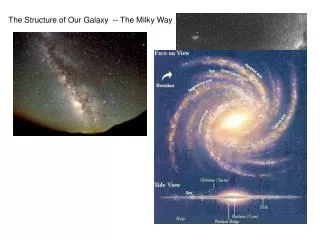
Galaxy Structure, Galaxy Clusters, Large Scale Structure, Hubble’s Law and the Distance Ladder Astronomy 100
The “Discovery” of Galaxies At the beginning of the 20th century, what we now call spiral galaxies were referred to as “spiral nebulae” and most astronomers believed them to be clouds of gas and stars associated with our own Milky Way. The breakthrough came in 1924 when Edwin Hubble was able to measure the distance to the “Great Nebula in Andromeda” (M 31, at right) and found its distance to be much larger than the diameter of the Milky Way. This meant that M 31, and by extension other spiral nebulae, were galaxies in their own right, comparable to or even larger than the Milky Way. (NOAO/AURA Photo) Edwin P. Hubble (1889-1953)
Galaxies • Star systems like our Milky Way • Contain a few thousand to tens of billions of stars. • Large variety of shapes and sizes
Distance Measurements to Other Galaxies (1) • Cepheid Method: Using Period – Luminosity relation for classical Cepheids: • Measure Cepheid’s Period Find its luminosity Compare to apparent magnitude Find its distance b) Type Ia Supernovae (collapse of an accreting white dwarf in a binary system): Type Ia Supernovae have well known standard luminosities Compare to apparent magnitudes Find its distances Both are “Standard-candle” methods: Know absolute magnitude (luminosity) compare to apparent magnitude find distance.
Cepheid Distance Measurement Repeated brightness measurements of a Cepheid allow the determination of the period and thus the absolute magnitude. Distance
The Most Distant Galaxies At very large distances, only the general characteristics of galaxies can be used to estimate their luminosities distances. Cluster of galaxies at ~ 4 to 6 billion light years
Doppler Shift The analogous phenomenon on Earth occurs with sound waves from a moving object, such as the police siren below. The stationary observer hears the pitch change from high to low as the siren passes.
Doppler shift applied to sound Christian Doppler, in 1842, published an equation describing this change in pitch. In the equation, fs is the siren’s pitch when stationary and fd is the pitch an observer (themselves moving at speed vd) hears when the siren is moving at a speed vs. v is the speed of sound.
Doppler shift applied to light But sound waves can change speed! So, when the analogy was made for the Doppler shift to apply to light, because light could not change speed, it was the wavelength (color) of light that would change. In the equation above, vrad is the radial (direct-line) velocity of an object, c is the speed of light, λrest is the wavelength of a color measured in a stationary (laboratory) frame and λshift is the wavelength of the same color measured from the moving object. Key point: if λshift > λrest, the object looks redder when moving, so this is called a red shift. In this case, then vrad is positive, and the object is moving away from us.
The problem with applying the Doppler equation to light Note that, for a really fast object, the wavelength emitted by that moving object can be so shifted that λshift – λrest > λrest , in which case the ratio on the right side is greater than one, which means that (on the left side) the object is moving faster than the speed of light. This is impossible!
The solution Special relativity states that no object can exceed the speed of light, and the equation for the Doppler shift applied to light can be modified: You can check this yourself, but even when the ratio on the left side is greater than one, vr < c, so no object moves faster than the speed of light. Indeed, it is Δλ = λshift (obs) – λrest that is the critical measurement.
Slipher’s Law? In 1912, Vesto Slipher discovered that with few exceptions, every galaxy is receding from us, i.e., its spectral lines are shifted from their normal (laboratory) position towards the red end of the spectrum. These spectra lines are said to exhibit redshift. Quantitatively, redshift is defined by the equation: z = Dl/l High z objects are those that have z > 1
Primer on galaxy spectra These are what galactic spectra look like; wavelength is along the x-axis and intensity is along the y-axis. Kennicutt (1992)
In the 1920s, Edwin Hubble determined the distances to dozens of galaxies using the Cepheid variable method. Combining that with Slipher’s redshift data, Hubble and Humason discovered that more distant galaxies are receding faster (have larger redshifts). • This relationship, well-fit by a straight line, is called Hubble’s Law. Hubble’s Law is written: Recessional velocity (km/s) = Ho distance (Mpc) Or: V = Ho D where Ho is Hubble’s constant (slope of the line). So are we the center of the universe!? No reason to think so, so why is everything leaving us??
Model: Universal Expansion · You can think of space as the surface of a balloon. As the balloon expands, the space between galaxies stretches. · This means that the wavelength of light photons emitted by galaxies are also stretched as space expands. That is to say, the wavelengths are expanded, i.e. redshifted.
If the rate of expansions stays constant over time, and all objects are together at t=0, current distance between two objects is d = v towhere to is current age of Universe Then, v = (1/to)d Same as Hubble’s law with identification Ho = 1/to Where 1/Ho is called the Hubble Time age of the Universe if expansion is constant (which is unlikely as we will see..) Ho has units of km/s/Mpc to express velocity and distance in convenient units (btw, Hubble’s first estimate of Ho was 500 km/s/Mpc, pretty far from the current value of around 70!)
How to determine the Hubble Constant We need to get accurate distances to the most distant galaxies we can see to measure the expansion rate of the Universe. Galaxy velocities must be dominated by the Hubble flow, not the random motions caused by gravitational attractions to nearby galaxies in groups, clusters, etc. Cepheids With their high luminosities (~10,000 Lsun), Cepheid variables extend the distance scale to nearby galaxies, out ~25 Mpc (80 million light years).
Type 1a SN Type-I supernova result from the detonation of white dwarf stars when their mass (slightly) exceeds 1.4 Msun. The brightness of the explosion should be (roughly) the same for every Type-1 supernova. Type-I Supernovae are standard candles. Knowing their luminosity, and comparing to their measured flux, yields the distance via the inverse-square law. Useful for determining distances out to (3 billion light years - 1 Gpc).
Tully-Fisher Relation (a broadened line) • Galaxy rotation is often measured via the 21cm atomic hydrogen line. • Rotation speed (line width) is proportional to the galaxy’s mass. • Galaxy luminosity is also proportional to galaxy mass (number of stars). • The correlation between luminosity and rotation speed is referred to as the Tully-Fisher relation.
Extending the distance scale allows us to put more galaxies on the Hubble Diagram and determine Hubble’s constant with greater accuracy. Type 1a SN
Each distance technique has uncertainties which then add to the error in determining the Hubble Constant Current values hover around 70 km/s/Mpc with an error of +/- 8 km/s/Mpc
The Cosmic Distance Ladder Hubble’s law allows us to measure distances to the “ends of the visible universe,” (~13 billion light years). It is less accurate for distances < 100 Mpc because of the “peculiar” velocities of galaxies (i.e. motions affected by local gravitational fields).
The Extragalactic Distance Scale • Many galaxies are typically millions or billions of parsecs from our galaxy. • Typical distance units: • Mpc = Megaparsec = 1 million parsec • Gpc = Gigaparsec = 1 billion parsec • Distances of Mpc or even Gpc The light we see left the galaxy millions or billions of years ago!! • “Look-back times” of millions or billions of years
Galaxy Sizes and Luminosities Vastly different sizes and luminosities: From small, low-luminosity irregular galaxies (much smaller and less luminous than the Milky Way) to giant ellipticals and large spirals, a few times the Milky Way’s size and luminosity
Rotation Curves of Galaxies From blue / red shift of spectral lines across the galaxy infer rotational velocity Plot of rotational velocity vs. distance from the center of the galaxy: Rotation Curve Observe frequency of spectral lines across a galaxy.
Rotation of Galaxies – The Missing Mass Problem The Doppler effect permits us to measure the speed of material orbiting around the center of a galaxy. Photographs of galaxies show that luminous material appears to be concentrated towards the center and drops off with increasing distance. Observed Expected Orbital speed Distance from galaxy center If matter were really concentrated in this fashion, we would see “rotation curves” following the “expected” path in the diagram at right. What is invariably observed instead is that rotation curves tend to remain high as far out as they can be measured. This implies the existence of massive halos of dark matter in galaxies. The nature of the material comprising this dark matter is completely unknown at present, making this one of the greatest problems of contemporary astronomy.
Determining the Masses of Galaxies Based on rotation curves, use Kepler’s 3rd law to infer masses of galaxies
Properties of Galaxies Property Spirals Ellipticals Irregulars Mass/M of Sun 109 to 4x10¹¹ 105 to 1013 108 to 3x10¹⁰ Luminosity/L of Su 108 to 2x10¹⁰ 3x10⁵ to 1011 107 to 3x10⁹ Diameter (light years) 16x103 to 8x10⁵ 3x10³ to 7x10⁵ 3x10³ to 3x10⁴ %-age of galaxies 77% 20% 3% National Optical Astronomy Observatory images From this table, you should take note of which galaxies are the most and least massive, most and least luminous, and largest and smallest in size.
Supermassive Black Holes From the measurement of stellar velocities near the center of a galaxy: Infer mass in the very center central black holes! Several million, up to more than a billion solar masses! Supermassive black holes
Dark Matter • Adding “visible” mass in: • stars, • interstellar gas, • dust, • …etc., we find that most of the mass is “invisible”! • The nature of this “dark matter” is not understood at this time. • Some ideas: brown dwarfs, small black holes, exotic elementary particles.
Clusters of Galaxies Galaxies generally do not exist in isolation, but form larger clusters of galaxies. Rich clusters: 1,000 or more galaxies, diameter of ~ 3 Mpc, condensed around a large, central galaxy Poor clusters: Less than 1,000 galaxies (often just a few), diameter of a few Mpc, generally not condensed towards the center
Gravitational Lensing in Abell 2218 Cluster As predicted by Einstein’s General Theory of Relativity, a compact intervening object is bending and distorting light from individual members of this cluster so that we see a halo effect. Hubble Space Telescope Image
A Lensed Quasar An intervening galaxy between us and this distant quasar is causing light from the quasar to be bent along curved paths that give rise to an Einstein cross, a phenomenon predicted by Einstein’s General Theory of Relativity. National Optical Astronomy Observatories Image
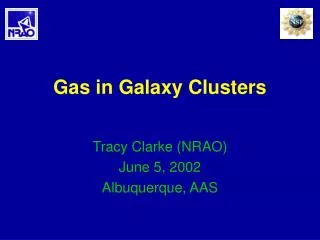
Hot Gas in Clusters of Galaxies Space between galaxies is not empty, but filled with hot gas (observable in X-rays) That this gas remains gravitationally bound provides further evidence for dark matter. Visible light X-rays Coma Cluster of Galaxies
Our Galaxy Cluster: The Local Group Milky Way Andromeda galaxy Small Magellanic Cloud Large Magellanic Cloud
Neighboring Galaxies Some galaxies of our local group are difficult to observe because they are located behind the center of our Milky Way, from our view point. Spiral Galaxy Dwingeloo 1
Interacting Galaxies Cartwheel Galaxy Particularly in rich clusters, galaxies can collide and interact. Galaxy collisions can produce ring galaxies and tidal tails. NGC 4038/4039 Often triggering active star formation: starburst galaxies
Tidal Tails Example for galaxy interaction with tidal tails: The Mice Computer simulations produce similar structures.
Simulations of Galaxy Interactions Numerical simulations of galaxy interactions have been very successful in reproducing tidal interactions like bridges, tidal tails, and rings.
Mergers of Galaxies Radio image of M 64: Central regions rotating backward! NGC 7252: Probably result of merger of two galaxies, ~ a billion years ago: Small galaxy remnant in the center is rotating backward! Multiple nuclei in giant elliptical galaxies
Galactic Cannibalism • Collisions of large with small galaxies often result in complete disruption of the smaller galaxy. • Small galaxy is “swallowed” by the larger one. NGC 5194 • This process is called “galactic cannibalism”
Starburst Galaxies Starburst galaxies are often very rich in gas and dust; bright in infrared: ultraluminous infrared galaxies M 82 Cocoon Galaxy
Galaxy Clusters • Half of all galaxies are in clusters (higher density; more Es and S0; mass > few times 1014-1015) or groups (less dense; more Sp and Irr; less than 1014Msun) • Clusters contain 100s to 1000s of gravitationally bound galaxies • Typically ~few Mpc across • Central Mpc contains 50 to 100 luminous galaxies (L > 2 x 10¹⁰ Lsun) • Abell’s catalogs (1958; 1989) include 4073 rich clusters • Both luminous Es and dEs more concentrated in clusters than mid-size Es (?) • Nearest rich clusters are Virgo and Fornax (containing 1000’s of galaxies; d=15-20 Mpc) • Richer cluster, Coma, at d=70 Mpc and 7 Mpc across • Clusters filled with hot gas (T=107 – 108 K X-ray bright – strips away cool gas of infalling galaxies Coma Cluster
Groups of galaxies are smaller than clusters • Contain less than ~100 galaxies • Loosely (but still gravitationally) bound • Contain more spirals and irregular galaxies than clusters “The Local Group”
Distribution of galaxies in a cluster falls as r1/4 (like surface brightness of elliptical galaxies) • May be dynamically relaxed systems • Crossing time in a typical cluster (galaxy moving at 1000 km/s, cluster size 1 Mpc) 109 years • Thus, clusters must be gravitationally bound systems and have possibly had enough time to “relax” If clusters are relaxed systems, we can use the virial theorem to estimate their masses M = (5/3)(<v2>R/G) eq. 13.47 Using radial velocity component only (Doppler shifts) M = 5<vr2>R/G eq. 13.52 For Coma cluster, vrms = 860 km/s and cluster size 6.1 Mpc, what is mass? M = 5 x 10¹⁵ Msun
Clusters have a Dark Matter problem too... • Luminous matter does not make up this mass • LB ~ 8 x 10¹² LB,sun • M/LB ~ 250 Msun/LB,sun • Adding up mass in DM halos of spiral galaxies still not enough • Look for mass in hot, intracluster gas - T=107K • Estimate gas mass from diffuse X-ray emission Significant mass in gas – can be up to 10 times stellar mass Dynamical (virial) measurements indicate this accounts for about 20% of the mass...
Mass appears to be contained in individual galaxy halos that extend further than we can measure Clusters seem to have their own Dark Matter halos M/L ratios for clusters is 200:1 Example of dark matter evidence in clusters (and the exotic nature of DM) The Bullet Cluster
Many clusters have a central dominant or cD galaxy at their center (e.g. M87 in Virgo) • contain multiple nuclei • could come from merger of central galaxies • galactic cannibalism Numerical simulations reveal what happens to the stars and gas when two galaxies collide and merge Note: most mergers are actually thought to occur in groups rather than clusters. Why? The relative velocities of galaxies in groups are slower (v = 100 to 500 km/s) allowing them to have greater interactions.