Download

1 / 26
260 likes | 331 Vues
Permeability: An Overlooked Control on the Strength of Subduction Megathrusts?. Insights from shallow drilling, lab experiments, and numerical models. I. In Situ Pore Pressure Estimates: Methods Direct measurements (sub-sea wellheads: CORKs) Laboratory consolidation tests to “high” stress

E N D
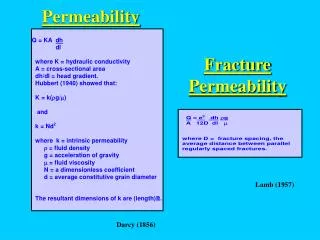
Permeability: An Overlooked Control on the Strength of Subduction Megathrusts? Insights from shallow drilling, lab experiments, and numerical models
I. In Situ Pore Pressure Estimates: Methods • Direct measurements (sub-sea wellheads: CORKs) • Laboratory consolidation tests to “high” stress • requires samples • 8-20 MPa load • Field data: porosity–depth trends • requires “reference” borehole • high-quality porosity measurements
10-15 1.65 10-16 k (m2) 1.6 10-17 void ratio 10-18 1.55 2 2.5 3 3.5 4 4.5 1.5 1.45 1.4 1.35 1.3 Laboratory Measurements: Permeability and Consolidation Pc’ virgin consolidation curve void ratio rebound curve 1 10 100 1000 10000 effective stress (kPa)
Sediment Margin Wedge Ocean Crust Costa Rican Margin Wedge and Underthrust Sediments SW NE Site 1040 4.0 Site 1043 Site 1039 4.5 depth (km bsl) 5.0 1 km
1040 Thinning of Units Based on Density Logs B u l k d e n s i t y 100 3 ( g / c m ) Deformed Wedge (Terrigenous Clay) 200 1043 300 100 1039 Décollement 400 Upper Hemipelagic 200 (Diatomaceous ooze) Lower Hemipelagic 100 (Clay) Upper Pelagic (Chalk) depth (mbsf) 200 Lower Pelagic (Chalk with ash) 300 Gabbroic Sill 1.2 1.2 1.2 1.6 1.6 1.6 2.0 2.0 2.0
150 350 200 400 250 450 300 500 350 550 400 600 450 650 500 700 1 3 5 7 9 4 6 8 10 Site 1043 Site 1040 Unit I Unit I Unit II Unit II Unit III Unit III depth (mbsf) lithostatic lithostatic hydrostatic hydrostatic pressure (MPa) pressure (MPa)
Site 1039 Site 1043 Site 1040 Unit I Unit I Unit I 0 20 Unit II Unit II Unit II 40 Unit III Unit III Unit III 60 fully drained fully drained 80 100 120 1 1 1 2 2 2 3 3 3 4 4 4 5 5 5 effective stress (MPa) effective stress (MPa) effective stress (MPa) height of solids below decollement (m)
s 1 s s 1 1 s 1 s s 1 1 Mechanical Implications Increased Subduction depth depth effective stress (sv’) effective stress (sv’) effective stress (sv’)
948 1045 1046 1047 500 400 300 420 CORK CORK 440 340 lithostatic 540 460 hydrostatic 480 380 580 500 Pc’ (lab) 520 2000 4000 6000 8000 10000 4000 6000 8000 10000 12000 2000 4000 6000 8000 10000 2000 4000 6000 8000 10000 pressure (kPa) pressure (kPa) pressure (kPa) pressure (kPa) Site 1044 1.5 km (Site 672) 5.0 5.5 Ocean Crust 6.0
Comparison of Subduction Zones 6000 5000 4000 excess pore pressure (kPa) Nankai 3000 2000 Barbados 1000 Costa Rica 0 0 2 4 6 8 10 G · L/K dimensionless number: ratio of “geologic forcing”/”hydraulic conductivity”
Ii. “A Hydro-mechanical balancing act”: geometry as a response to fluid sources and escape: Pore Pressure Geometry Strain Rate Fluid Sources Pore Pressure Geometry Permeability Existing model “New” model
Proposed Model of Accretionary Wedge Evolution . well drained High K/Q: poorly drained Low K/Q: retarded fluid escape elevated pore pressures rapid fluid escape low pore pressures high basal shear stress wedge steepens internally low basal shear stress wedge grows self-similarly TIME steep stable geometry shallow stable geometry
Taper Angles Near Toe Seismic Sections Here Muroto: Taper angle ~4° Ashizuri: Taper angle ~8-10°
Thinner Trench-wedge • turbidites • - No L. Shikoku turbidites
Hypothesis: Differences in stratigraphy result in systematic differences in pore pressure, causing differences in taper angle along-strike. Method: Use numerical model of fluid flow to evaluate whether this is plausible. If so, what conditions are necessary?
Schematic of Model Domain 3000 4000 decollement 5000 Depth (mbsl) 6000 7000 8000 9000 -50 -40 -30 -20 -10 0 10 distance arcward from deformation front (km) landward seaward
Compaction-Driven Fluid Sources: Porosity Reduction + Porous sediment Compacted sediment Fluid
60% -13 50% 40% -14 30% 20% -15 10% -16 2 Porosity Distribution 1 0 depth (km) -1 -2 -3 50 40 30 20 10 0 -10 2 Source Distribution 1 0 depth (km) log source Vol/Vols-1 -1 -2 -3 50 40 30 20 10 0 distance arcward from deformation front (km)
Permeability-Porosity Relation 1 Compiled data for argillaceous rocks (Neuzil, 1994) 0.8 0.6 Gulf of Mexico Shikoku Basin (Inverse Models) 0.4 Compiled sandstone data Barbados 0.2 0 10-22 10-20 10-18 10-16 10-14 permeability (m2)
Model Domains MUROTO 3000 Turbidites 4000 Depth (mbsl) 5000 Hemipelagic Clays 6000 7000 8000 ASHIZURI 2000 Turbidites 4000 Depth (mbsl) 6000 Hemipelagic Clays 8000 10000 12000 -50 -40 -30 -20 -10 0 10
Example Pore Pressure Results MUROTO TRANSECT depth (m) l ASHIZURI TRANSECT depth (m) distance from trench (km)
1 0.95 0.9 0.85 0.8 0.75 0.7 0.65 0.6 0.6 0.65 0.7 0.75 0.8 0.85 0.9 0.95 1 Pore Pressure and Wedge Stability Muroto Stability Field m = 0.65 Ashizuri Stability Field l base m = 0.45 Kturb = 3 x Khemi Kturb = 10 x Khemi l wedge
MODEL RESULTS OBSERVATIONS 15 a , = 13 20 km a ; = 4 10 20 km a ; = 5 5 a ; = 1.5 20 km a ; = 1 20 km -22 -21` -20 -19 -18 100 80 60 40 20 0 log (ko) % of penetrated incoming section dominated by clay Taper angle
Implications: • Morphology and strength of subduction complexes • a result of dynamic balance between geologic forcing • and fluid escape • - strength of brittle crust in other settings? • Permeability and plate convergence are important • - affect pore pressure • - influence stable taper angle, fault strength • Other factors also important • - incoming sediment thickness • - fault zone permeability, hydraulic fracture • - systematic variation in stratigraphic section