Download
1 / 1
20 likes | 136 Vues
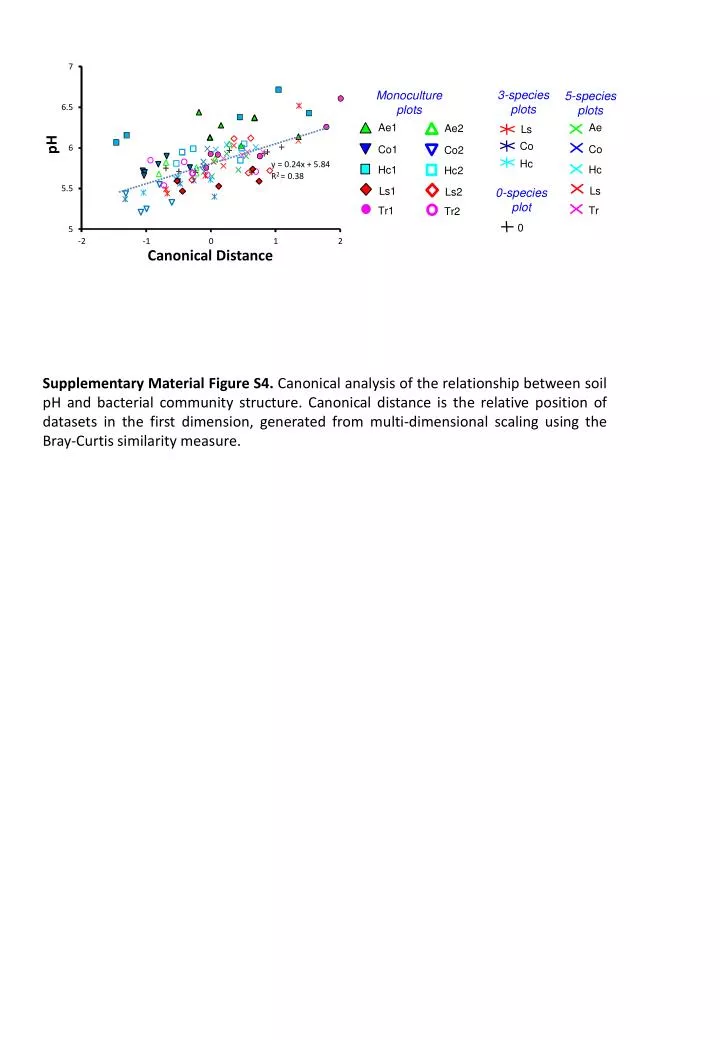
7. 3-species plots. Monoculture plots. 5-species plots. 6.5. Ae. Ae1. Ae2. Ls. pH. Co. 6. Co. Co1. Co2. Hc. y = 0.24x. + 5.84. Hc. Hc1. Hc2. 2. R. = 0.38. 5.5. Ls. Ls1. 0 -species plot. Ls2. Tr. Tr1. Tr2. 0. 5. -. 2. -. 1. 0. 1. 2. Canonical Distance.

E N D
7 3-species plots Monoculture plots 5-species plots 6.5 Ae Ae1 Ae2 Ls pH Co 6 Co Co1 Co2 Hc y = 0.24x + 5.84 Hc Hc1 Hc2 2 R = 0.38 5.5 Ls Ls1 0-species plot Ls2 Tr Tr1 Tr2 0 5 - 2 - 1 0 1 2 Canonical Distance Supplementary Material Figure S4. Canonical analysis of the relationship between soil pH and bacterial community structure. Canonical distance is the relative position of datasets in the first dimension, generated from multi-dimensional scaling using the Bray-Curtis similarity measure.