Download
1 / 19
190 likes | 256 Vues
Explore the concepts of K Nearest Neighbors (KNN) and Decision Trees in the realm of machine learning. Understand the advantages, disadvantages, training parameters, and typical settings for KNN. Delve into the intricacies of Binary Decision Trees and Linear Decision Trees, as well as the Chi-Squared Automatic Interaction Detector (CHAID). Learn about Classification and Regression Trees (CART) and their applications in pattern recognition. Discover the methodology, node structures, and pruning rules associated with Decision Trees. Enhance your understanding of these powerful classification algorithms for predictive modeling.

E N D
X K Nearest Neighbors Classifier & Decision Trees
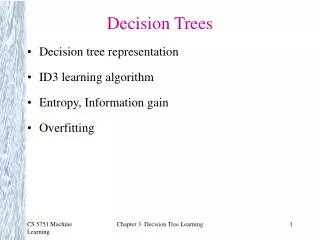
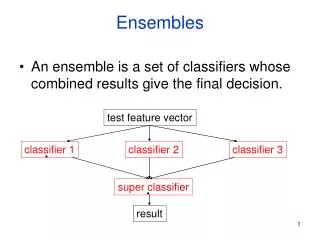
Content • K Nearest Neighbors • Decision Trees • Binary Decision Trees • Linear Decision Trees • Chi-Squared Automatic Interaction Detector (CHAID) • Classification and Regression Trees (CART)
K Nearest Neighbors • K Nearest Neighbors • Advantage • Nonparametric architecture • Simple • Powerful • Requires no training time • Disadvantage • Memory intensive • Classification/estimation is slow
K Nearest Neighbors • The key issues involved in training this model includes setting • the variable K • Validation techniques (ex. Cross validation) • the type of distant metric • Euclidean measure
X Stored training set patterns X input pattern for classification --- Euclidean distance measure to the nearest three patterns Figure K Nearest Neighbors Example
Store all input data in the training set For each pattern in the test set Search for the K nearest patterns to the input pattern using a Euclidean distance measure For classification, compute the confidence for each class as Ci /K, (where Ciis the number of patterns among the K nearest patterns belonging to class i.) The classification for the input pattern is the class with the highest confidence.
Training parameters and typical settings • Number of nearest neighbors • The numbers of nearest neighbors (K) should be based on cross validation over a number of K setting. • When k=1 is a good baseline model to benchmark against. • A good rule-of-thumb numbers is k should be less than the square root of the total number of training patterns.
Training parameters and typical settings • Input compression • Since KNN is very storage intensive, we may want to compress data patterns as a preprocessing step before classification. • Using input compression will result in slightly worse performance. • Sometimes using compression will improve performance because it performs automatic normalization of the data which can equalize the effect of each input in the Euclidean distance measure.
Root node • Nodes of the tree • Leaves (terminal nodes) of the tree • Branches (decision point) of the tree C A A B B B B Decision trees • Decision trees are popular for pattern recognition because the models they produce are easier to understand.
BMI<24 No Yes No Yes Yes No Decision trees-Binary decision trees • Classification of an input vector is done by traversing the tree beginning at the root node, and ending the leaf. • Each node of the tree computes an inequality (ex. BMI<24, yes or no) based on a single input variable. • Each leaf is assigned to a particular class.
B C Decision trees-Binary decision trees • Since each inequality that is used to split the input space is only based on one input variable. • Each node draws a boundary that can be geometrically interpreted as a hyperplane perpendicular to the axis.
aX1+bX2 No Yes No Yes Yes No Decision trees-Linear decision trees • Linear decision trees are similar to binary decision trees, except that the inequality computed at each node takes on an arbitrary linear from that may depend on multiple variables.
Branch#2 Branch#3 Branch#1 Decision trees-Chi-Squared Automatic Interaction Detector (CHAID) • CHAID is a non-binary decision tree. • The decision or split made at each node is still based on a single variable, but can result in multiple branches. • The split search algorithm is designed for categorical variables.
Decision trees-Chi-Squared Automatic Interaction Detector (CHAID) • Continuous variables must be grouped into a finite number of bins to create categories. • A reasonable number of “equal population bins” can be created for use with CHAID. • ex. If there are 1000 samples, creating 10 equal population bins would result in 10 bins, each containing 100 samples. • A Chi2 value is computed for each variable and used to determine the best variable to split on.
Decision trees-Classification and regression trees (CART) • CLASSIFICATION AND REGRESSION TREES (CART) are binary decision trees, which split a single variable at each node. • The CART algorithm recursively goes though an exhaustive search of all variables and split values to find the optimal splitting rule for each node.
Decision trees-Classification and regression trees (CART) • The optimal splitting criteria at a specific node can be found as follow: • Φ(s’/t)=Maxi (Φ(s/t))
Training set Root node t tL tR Class j Class j CART Φ(s’/t)=Maxi (Φ(s/t)) tL= left offspring of node tR= right offspring of node
Decision trees-Classification and regression trees (CART) • Pruning rule • Cut off the branches of the tree R(t)=r(t)p(t) The sub-tree with the smallest g(t) can then be pruned form the tree.