Download
1 / 123
1.23k likes | 1.34k Vues
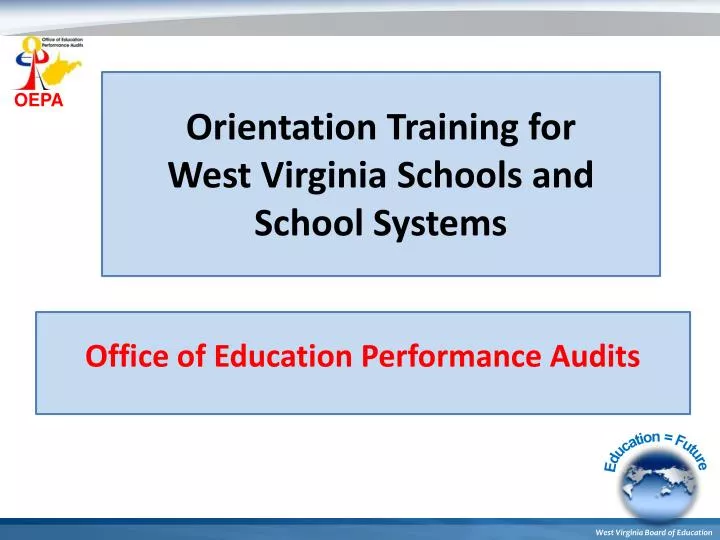
Orientation Training for West Virginia Schools and School Systems. Office of Education Performance Audits. Opening Comments Session Introduction Accreditation/Accountability Dr. Gus Penix Director, OEPA. Materials and Procedures. Materials a copy of today’s agenda

E N D
Orientation Training for West Virginia Schools and School Systems Office of Education Performance Audits
Opening Comments Session Introduction Accreditation/Accountability Dr. Gus Penix Director, OEPA
Materials and Procedures • Materials • a copy of today’s agenda • a copy of Policy 2322 • a copy of today’s Power Point, and • an Orientation Training Booklet • Procedures • Large Group Discussion and Questions • Agenda Timelines
TODAY’S PURPOSE The purpose of today’s presentation is to introduce you to: • the newly adopted Policy 2320, • the new accreditation process, and • the School Monitoring Report.
Section 2: Historical Perspective of Policy 2320 Dr. Donna Davis Deputy Director, OEPA
Background • WV Constitution charges the WVBE with the general supervision of public schools; this policy provides for this. • The policy is impacted by Resolution of the landmark case of Pauley vs. Bailey and led to“A Process for Improving Education,” the blueprint for WV’s standards-based accountability system. • This blueprint led to adoption of WV Code §18-2E-5 by the WV Legislature. • In 2013, SB 359 gave the WVBE authority to redefine sections of §18-2E-5 that impact school accreditation and accountability. • The new Policy 2320 (which repeals and replaces the former) is a result of the Governor’s leadership, direction from the WVBE Committee on Accountability, and input Stakeholders
Standards-Based Accountability System Accountability Accreditation
Rationale for Aligning Accountability and Accreditation Overview of Policy Sections Gus Penix Director, OEPA
NEW ACCREDITATION SYSTEM • The WVBE approved a new policy for accrediting WV’s schools and approving school systems, Policy 2320. • The new policy is the result of changes to WV Code §18-2E-5 in SB359. • These Code changes provided opportunity to align • the accountability system (what’s expected of schools) with • the accreditation system (how schools are rated). • This alignment placed a statewide emphasis on the improvement of student achievement in ALL schools.
Characteristics of the New Policy There are six major characteristics of the new policy: (1) improving student performance, (2) clearly communicating the level of school quality, (3) focusing on allschools, (4) purpose – quality and self-improvement, (5) emphasizing local control and accountability, and (6) differentiating supports, consequences, and rewards.
WVBE BELIEFS • All students deserve quality educational programs. • WV’s national rankings have declined. • Those rankings must change. • Every school has a responsibility to improve. The WVBE is committed to fulfilling its constitutional responsibilities in providing a quality education for all students through a system that monitors student performance outcomes and continuous improvement in schools.
Old and New Accreditation • RATIONALE – Eliminate Multiple Rating Systems: • Old - Schools received two different ratings. • New - Schools receive one rating. • RATIONALE – Create a System that Promotes Student Performance: • OLD - Focused school accreditation ratings on self-reported compliance. • NEW – Focuses on student performance measures.
Old and New Accreditation • RATIONALE – Use Language that is Easily Understood to Communicate School Quality: • OLD - Language was not easily understood. • NEW - Language is clearly understood. • RATIONALE – Focus on Improvement of All Schools: • OLD - Only low performing schools received reviews. • NEW - All schools receive a cyclical review every four years.
WVBE EXPECTATIONS Improve student performance. Align accountability and accreditation systems. Incentivize school improvement in all schools. Hold schools accountable for creating quality school and classroom conditions. Create a clear public reporting system. Create a unified school recognition program to recognize growth and performance. Enhance local control. Address requirements of §18-2E-5 to create a thorough and efficient system of public education. “What gets measured gets done.” “What gets monitored gets done well.”
Policy 2320 Sections Section 4 – Glossary Section 7 – School System Approval Section 10 – Rewards and Recognitions Section 11 – Needs analysis, Capacity Building and Efficiencies. Section 12 – Communication of Performance Grades and Approval Levels Section 13 – Operation of the OEPA Section 14 – General Appeals Procedures Section 15 – Severability
Section 3: Premises and Purposes Bill Niday Consultant, OEPA
Section 3: Premises and Purposes Premises All children can learn. The primary measure of an effective school is the quality and equity of student outcomes. The level of quality and equity must be public knowledge. The school is the unit of change. The capacity for excellence resides in every school.
Premises and Purposes Purposes Establishing standards and performance measures Holding schools and school systems accountable Implementing a system of public notification Evaluating educational progress Ensuring equity of opportunity
Premises and Purposes Purposes Providing a mechanism for continuous improvement Defining a system of supports and consequences Creating a recognition and reward process Aiding the Governor, Legislature, and WVBE in decision-making
Section 5: WV Accountability System Robert Hull Associate Superintendent, WVDE
Policy 2320, A Process for Improving Education: Performance Based Accreditation System • In January 2014, as part of his State-of-the-State Address, Governor Tomblin asked the WV Board of Education to establish a simple A-F School Grading System. • The WVBOE, working with the WVDE and WVOEPA, developed a system that unites school accountability and school and district accreditation into a single process. • Policy 2320 was placed for public comment on April 9, 2014 and approved on May 14, 2014 to become effective July 1, 2014. • Schools will receive their first A-F grade for the 2014-15 school year based on the data from the 2014-15 assessment.
Policy 2320, A Process for Improving Education: Performance Based Accreditation System • The WVDE will compile the data and assign each school a grade based upon the criteria set by the WVBOE. • The OEPA will review the results of the school audits to verify the grades can be assigned without modification and report them to the WVBOE. • The WVBOE will accept and officially release the school grades. • High performing schools will be recognized and low performing schools will receive supports and assistance.
Policy 2320, A Process for Improving Education: Performance Based Accreditation System • Measuring What We Value in West Virginia • All students learning • All students showing significant improvement rather than just incremental improvement • All students exhibiting growth at a rate that moves them to proficiency over time • All students performing at their highest levels • Accelerating the growth of those lowest performing students
Policy 2320, A Process for Improving Education: Performance Based Accreditation System • Grading Components • Achievement: Includes student proficiency in mathematics and reading/language arts. • Student growth: Includes how much students are growing (observed) and how much students are on track to be proficient (adequate). • Performance of Lowest 25%: Includes the accelerated improvement of the lowest 25% of students in each school. • Graduation rates for high schools: High schools will be awarded points based on each school’s four-year and five-year adjusted cohort graduation rates.
Policy 2320, A Process for Improving Education: Performance Based Accreditation System • Grade Designations • A = distinctive student proficiency • B = commendable student proficiency • C = acceptable student proficiency • D = unacceptable student proficiency • F = lowest student proficiency
Policy 2320, A Process for Improving Education: Performance Based Accreditation System
Policy 2320, A Process for Improving Education: Performance Based Accreditation System • Grade Assignment
Policy 2320, A Process for Improving Education: Performance Based Accreditation System • Proficiency Rates • 200 points based on % proficient in Math • 200 points based on % proficient in E/LA • Observed Growth • 100 points based on % of students exhibiting at least typical growth in Math • 100 points based on % of students exhibiting at least typical growth in E/LA • Adequate Growth • 100 points based on % of students meeting or exceeding growth target in Math • 100 points based on % of students meeting or exceeding growth target in E/LA • Lowest 25%: bottom quartile of students in the school • 100 points based on the % of students in the bottom 25% exhibiting high growth in Math • 100 points based on the % of students in the bottom 25% exhibiting high growth in E/LA • Graduation Rates for High School • 100 points based on % of students graduating in the 4-year cohort • 100 points based on % of students graduating in the 5-year cohort
Sample Scenarios Elementary Schools
Elementary Schools • School 1 – Blooming Rose Elementary School • Overall high performing school • Overall high growth school • School 2 – Trailing Vine Elementary School • Moderately performing school • Moderate observed growth • Low adequate growth • Lower performing lowest 25% • School 3 – Briar Patch Elementary Schools • Overall low performing school • Overall low growth school
Blooming Rose Elementary School • Overall high performing school • Overall high growth school
Trailing Vine Elementary School • Moderately performing school • Moderate observed growth • Low adequate growth • Lower performing bottom 25%
Briar Patch Elementary School • Overall low performing school • Overall low growth school
Sample Scenarios MIDDLE Schools
Middle Schools • Hickory Middle School • Overall high performing school • Overall high growth school • Walnut Middle School • Moderately performing school • Moderate observed growth • Low adequate growth • Lower performing bottom 25% • Oak Middle School • Overall low performing school • Overall low growth school
Hickory Middle School • Overall high performing school • Overall high growth school
Walnut Middle School • Moderately performing school • Moderate observed growth • Moderate adequate growth • Lower performing bottom 25%
Oak Middle School • Overall low performing school • Overall low growth school
Sample Scenarios High Schools
High Schools • Evergreen High School • Overall high performing school • Overall high growth school • High graduation rates • Hemlock High School • Moderately performing school • Moderately high observed growth • Low adequate growth • Lower performing bottom 25% • Moderate graduation rates • Redwood High School • Overall low performing school • Overall low growth school • Low graduation rates
Evergreen High School • Overall high performing school • Overall high growth school • High graduation rates
Hemlock High School • Moderately performing school Lower performing bottom 25% • Moderately high observed growth Moderate graduation rates • Low adequate growth
Redwood High School • Overall low performing school • Overall low growth school • Low graduation rates
Points of Clarity • Requires an amendment to the ESEA Flexibility Request • Based on initial conversations, USDOE appears amenable to the concepts presented but negotiations could result in minor metric changes based on the review of impact data • Accountability includes all tested grades 3-11 • Cell size is 10 • Only impacts observed growth (average of sub groups) and lowest 25% calculations; all other calculations are based on the “all” group • Will report all subgroups for public transparency and for services delivered via the strategic plan.
Points of Clarity • Priority and Focus status remains a federal requirement but will not impact school grades • Priority Schools • Still at the 5th percentile of Title I schools • Based on total index rather than just proficiency (should have little effect because of proficiency being so heavily embedded in the index) • Focus Schools • Two definitions in USDOE guidance • Schools with the greatest achievement gaps (used in current system) • Lowest performing subgroups (used in amendment) • Finalized once impact data are available to ensure representation of appropriate students • Supports required for both as we currently have in place • Those currently identified will remain for the initial 3 year period