Download
1 / 77
770 likes | 918 Vues
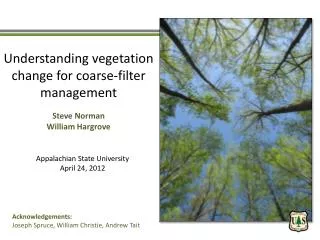
Understanding vegetation change for coarse-filter management Steve Norman William Hargrove. Appalachian State University April 24, 2012. Acknowledgements: Joseph Spruce, William Christie, Andrew Tait. 2012-04-16. 2009-04-17. 2009-04-27. Large Fires in the US: 1984-2011. GeoMAC MTBS.

E N D
Understanding vegetation change for coarse-filter management Steve Norman William Hargrove Appalachian State University April 24, 2012 Acknowledgements: Joseph Spruce, William Christie, Andrew Tait
Large Fires in the US: 1984-2011 GeoMAC MTBS
Large Fires in the US: 1984-2011 GeoMAC MTBS
Invasive species can lead to novel change
2010 STATE FOREST ASSESSMENTS AND STRATEGIES
Critical Forest Management Needs • Knowing what’s happening (monitoring) • Understanding relevant science (assessment) • Planning ahead (predicting) • Implementing effort based on values at risk • and tradeoffs (prioritizing)
If you were a manager, which science would you prefer? IMPRECISE PRECISE Accurate Inaccurate Accurate Inaccurate
Highly precise, but inaccurate “The Future” Semi-accurate, but not precise Frequency Value Coarse-filter science targets accuracy over precision
What is Ecological Resilience? The ability of species or communities to persist over time because of or despite disturbance (e.g., fire, wind, logging, insects, invasives, development, etc.) or climate variability and change, given the evolutionary attributes of species.
What is Ecological Resilience? The ability of species or communities to persist over time because of or despite disturbance (e.g., fire, wind, logging, insects, invasives, development, etc.) or climate variability and change, given the evolutionary attributes of species. High Basins of attraction form stable states POTENTIAL ENERGY Low STATES
What is Ecological Resilience? The ability of species or communities to persist over time because of or despite disturbance (e.g., fire, wind, logging, insects, invasives, development, etc.) or climate variability and change, given the evolutionary attributes of species. High Stress can temporarily lead to unstable states POTENTIAL ENERGY Low STATES
What is Ecological Resilience? The ability of species or communities to persist over time because of or despite disturbance (e.g., fire, wind, logging, insects, invasives, development, etc.) or climate variability and change, given the evolutionary attributes of species. High Resilience is the dynamic between stress and stability POTENTIAL ENERGY Low STATES
Frequency versus Resolution L5: June 22, 2009 L5: June 6, 2009 June 22, 2009
MODIS SENSOR: Moderate resolution imaging spectro-radiometer (36 spectral bands)
Normalized Difference Vegetation Index Stressed REFLECTACNE Healthy Modified from Kyllo 2003 (sugar beets) NIR MODIS wavelengths: 630 - 690 nm 780-900 nm (Near Infrared) – (Red) (Near Infrared) + (Red) NDVI =
ForWarn • MODIS-based • Moderate resolution (~240m; 14ac) • 2000 – present • Conterminous US • 24-day window; 8-day steps • Normalized Difference Vegetation • Index (NDVI) • Maps of change in NDVI from multiple baselines (1, 3, all year) An 11-year, 8 day NDVI time series for Appalachian State University, Boone NC
Land Surface Phenology of Eastern Deciduous Forest 1.0 Max. Amplitude Duration Min. 0.5 (Normalized Difference Vegetation Index) NDVI 0.0 Day of Year
Land Surface Phenology of Four Vegetation Types during 2008 1.0 0.5 (Normalized Difference Vegetation Index) NDVI 0.0 Day of Year
Can we measure short-term severity? • Can we observe multi-year recovery? • Can we detect “stable state” transitions? High POTENTIAL ENERGY Low STATES
April 27, 2011 Tuscaloosa, Alabama Tornado NASA: EO-1 – ALI May 7, 2011
April 27, 2011 Tuscaloosa Alabama, Tornado ForWarn Forest Change image (1 year baseline) Jun 1, 2011
Within year disturbance-associated departures in NDVI Theoretical response: Low Severity NDVI • Minor reduction in NDVI • Within-season recovery Baseline Moderate Severity • Moderate reduction in NDVI • Growing season persistence NDVI High Severity • Major reduction in NDVI • Growing season persistence NDVI
Within year disturbance-associated departures in NDVI April 24, 2010 EF4 Tornado, Yazoo City, MS Observed: Predicted response: Low Severity Low Severity NDVI Baseline Moderate Severity Moderate Severity NDVI High Severity High Severity NDVI 2006 2007 2008 2009 2010
Leaf loss, then recovery in Tennessee ForWarn Kingsport Kingsport Full-fledged tornados are typically well documented, but the massive outbreak of April 2011 also had localized short-term effects that are easily overlooked. This image pair from a month after the storm (top) and two months later (bottom) shows how fast seemingly severe damage can recover, in this case a ridgeline forest southwest of Kingsport, Tennessee. While such ephemeral disturbances can reduce summertime productivity, it takes high frequency forest monitoring to know that these events have even occurred. Kingsport Kingsport June 1, 2011 July 3, 2011
Kylbl, Kentucky (RAWS) Weather Station Land Between The Lakes The average minimum temperature from Mar 20 to Apr 2 was 60oF. (The minimum temp. was above average for 15 days running). Minimum Daily Temperature (oF) freezing 21oF on April 8th http://www.raws.dri.edu/cgi-bin/rawMAIN.pl?ncKKYL
Atmospheric Drivers of the April 2007 Hard Frost 500 mb Geopotential Height (m) Composite Mean March 26, 2007 500 mb Geopotential Height (m) Composite Mean April 7, 2007 Source: NOAA/ESRL Physical Sciences Division. NCEP/NCAR Reanalysis
Land Between the Lakes The number of dots (8-week data intervals) during greenup reflect the rate and duration of Spring. Note that 2007 had more than any year between 2000 and 2010.
Land Between the Lakes Zoomed in, this extended 2007 spring is explained by an abrupt event in early April that arrested vegetational development for about 2 weeks.
Mountain Pine Beetle Black Hills
Can we measure short-term severity? • Can we observe multi-year recovery? • Can we detect “stable state” transitions? High POTENTIAL ENERGY Low STATES
Texas Panhandle March 2006 Amarillo Complex
Drought takes a toll on Texas trees ForWarn The forests of Texas continue to suffer through one of the most extreme droughts on record and a large number of trees have already died. The photo shows mortality in Memorial Park, Houston (Ron Billings, Texas Forest Service). By late August of 2011, the regional change in greenness from the prior year were extreme. Across the map, this decline was caused by the combined effects of drought and fire. By December of 2011, some recovery occurred as shown in blue, but this December condition is only with respect to conditions in December of 2010, which was also in drought. Note, the persisting anomaly near the western extent of the state's forests (above the word “Mexico”). Such transitional or “ecotonal” landscapes, where forest and grassland meet, are highly sensitive to climate extremes. See the Texas Forest Service website for more information on this event (http://txforestservice.tamu.edu). Texas Texas Mexico Mexico August 28, 2011 December 26, 2011
6/2007 F3 Tornado June 7, 2007 6/2007
Yazoo City, MS tornado recovery ForWarn June 17, 2010 compared to 2009 June 17, 2011 compared to 2010
2006 Western Nevada
1.0 July 2006 0.5 0.0 2000 2001 2002 2003 2004 2005 2006 2007 2008 2009 2010 Superior National Forest Duluth Boundary Waters Wilderness, Minnesota Photo credit: Steve Foss, 2011; Pagami Creek Complex
1.0 4/2007 11/2000 0.5 0.0 2000 2001 2002 2003 2004 2005 2006 2007 2008 2009 2010 Linville Gorge Fires Pisgah National Forest, North Carolina
Can we measure short-term severity? • Can we observe multi-year recovery? • Can we detect “stable state” transitions? High POTENTIAL ENERGY Low STATES
Great Smoky Mountains National Park, NC 1.0 1.0 0.5 0.5 A typical deciduous signature 2000 2001 2002 2003 2004 2005 2006 2007 2008 2009 2010 A declining evergreen fraction transitioning to a deciduous forest signature 2000 2001 2002 2003 2004 2005 2006 2007 2008 2009 2010
Great Dismal Swamp National Wildlife Refuge “Hurricane Isabel inflicted considerable changes to the refuge landscape on September 18, 2003. Several thousand acres of Atlantic white cedar forests were destroyed, and countless trees were blown down through- out the refuge, creating a potentially volatile fire situation. Without restoration, significant Atlantic white cedar acreage will be lost. The potential for catastrophic fires due to the added fuels created by the hurricane will continue to pose a risk.” Final Comprehensive Conservation Plan, July 2006 VA NC SC http://library.fws.gov/CCPs/GDS/greatdismalswamp06.pdf