Download
1 / 40
400 likes | 518 Vues
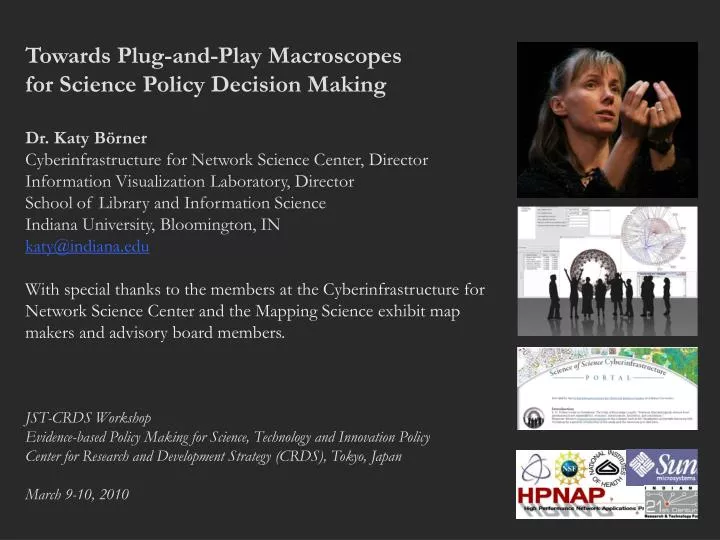
Towards Plug-and-Play Macroscopes for Science Policy Decision Making Dr. Katy Börner Cyberinfrastructure for Network Science Center, Director Information Visualization Laboratory, Director School of Library and Information Science Indiana University, Bloomington, IN katy@indiana.edu

E N D
Towards Plug-and-Play Macroscopes for Science Policy Decision Making Dr. Katy Börner Cyberinfrastructure for Network Science Center, Director Information Visualization Laboratory, Director School of Library and Information Science Indiana University, Bloomington, IN katy@indiana.edu With special thanks to the members at the Cyberinfrastructure for Network Science Center and the Mapping Science exhibit map makers and advisory board members. JST-CRDS Workshop Evidence-based Policy Making for Science, Technology and Innovation Policy Center for Research and Development Strategy (CRDS), Tokyo, Japan March 9-10, 2010
Star Scientist -> Research Teams: In former times, science was driven by key scientists. Today, science is driven by effectively collaborating co-author teams often comprising expertise from multiple disciplines and several geospatial locations (Börner, Dall'Asta, Ke, & Vespignani, 2005; Shneiderman, 2008). Users -> Contributors: Web 2.0 technologies empower anybody to contribute to Wikipedia and to exchange images and videos via Fickr and YouTube. WikiSpecies, WikiProfessionals, or WikiProteins combine wiki and semantic technology in support of real time community annotation of scientific datasets (Mons et al., 2008). Cross-disciplinary: The best tools frequently borrow and synergistically combine methods and techniques from different disciplines of science and empower interdisciplinary and/or international teams of researchers, practitioners, or educators to fine-tune and interpret results collectively. One Specimen -> Data Streams: Microscopes and telescopes were originally used to study one specimen at a time. Today, many researchers must make sense of massive streams of multiple types of data with different formats, dynamics, and origin. Static Instrument -> Evolving Cyberinfrastructure (CI): The importance ofhardware instruments that are rather static and expensive decreases relative to software infrastructures that are highly flexible and continuously evolving according to the needs of different sciences. Some of the most successful services and tools are decentralized increasing scalability and fault tolerance. Modularity: The design of software modules with well defined functionality that can be flexibly combined helps reduce costs, makes it possible to have many contribute, and increases flexibility in tool development, augmentation, and customization. Standardization: Adoption of standards speeds up development as existing code can be leveraged. It helps pool resources, supports interoperability, but also eases the migration from research code to production code and hence the transfer of research results into industry applications and products. Open data and open code: Lets anybody check, improve, or repurpose code and eases the replication of scientific studies. The Changing Scientific Landscape
Just as the microscope empowered our naked eyes to see cells, microbes, and viruses thereby advancing the progress of biology and medicine or the telescope opened our minds to the immensity of the cosmos and has prepared mankind for the conquest of space, macroscopes promise to help us cope with another infinite: the infinitely complex. Macroscopes give us a ‘vision of the whole’ and help us ‘synthesize’. They let us detect patterns, trends, outliers, and access details in the landscape of science. Instead of making things larger or smaller, macroscopes let us observe what is at once too great, too slow, or too complex for our eyes. Microscopes, Telescopes, and Macrocopes
Division of Labor: Ideally, labor is divided in a way that the expertise and skills of computer scientists are utilized for the design of standardized, modular, easy to maintain and extend “core architecture”. Dataset and algorithm plugins, i.e., the “filling”, are initially provided by those that care and know most about the data and developed the algorithms: the domain experts. Ease of Use: As most plugin contributions and usage will come from non-computer scientists it must be possible to contribute, share, and use new plugins without writing one line of code. Wizard-driven integration of new algorithms and data sets by domain experts, sharing via email or online sites, deploying plugins by adding them to the ‘plugin’ directory, and running them via a Menu driven user interfaces (as used in Word processing systems or Web browsers) seems to work well. Plugin Content and Interfaces: Should a plugin represent one algorithm or an entire tool? What about data converters needed to make the output of one algorithm compatible with the input of the next? Should those be part of the algorithm plugin or should they be packaged separately? Supported (Central) Data Models: Some tools use a central data model to which all algorithms conform, e.g., Cytoscape, see Related Work section. Other tools support many internal data models and provide an extensive set of data converters, e.g., Network Workbench, see below. The former often speeds up execution and visual rendering while the latter eases the integration of new algorithms. In addition, most tools support an extensive set of input and output formats. Core vs. Plugins: As will be shown, the “core architecture” and the “plugin filling” can be implemented as sets of plugin bundles. Answers to questions such as: “Should the graphical user interface (GUI), interface menu, scheduler, or data manager be part of the core or its filling?” will depend on the type of tools and services to be delivered. Supported Platforms: If the software is to be used via Web interfaces then Web services need to be implemented. If a majority of domain experts prefers a stand-alone tool running on a specific operating system then a different deployment is necessary. Desirable Features of Plug-and-Play Macroscopes
Scholarly Database: 23 million scholarly records http://sdb.slis.indiana.edu Information Visualization Cyberinfrastructure http://iv.slis.indiana.edu Network Workbench Tool + Community Wiki http://nwb.slis.indiana.edu Sci2 Tool and Science of Science CI Portal http://sci.slis.indiana.edu Epidemics Cyberinfrastructure http://epic.slis.indiana.edu/ CI for a Science of Science Studies 7
Scholarly Database: Web Interface Search across publications, patents, grants. Download records and/or (evolving) co-author, paper-citation networks. Register for free access at http://sdb.slis.indiana.edu
Since March 2009:Users can download networks: - Co-author - Co-investigator - Co-inventor - Patent citationand tables for burst analysis in NWB.
Datasets available via the Scholarly Database (* internally) Aim for comprehensive time, geospatial, and topic coverage. Scholarly Database: # Records, Years Covered
Network Workbench Toolhttp://nwb.slis.indiana.edu The Network Workbench (NWB) tool supports researchers, educators, and practitioners interested in the study of biomedical, social and behavioral science, physics, and other networks. In February 2009, the tool provides more 169 plugins that support the preprocessing, analysis, modeling, and visualization of networks. More than 50 of these plugins can be applied or were specifically designed for S&T studies. It has been downloaded more than 35,000 times since December 2006. Herr II, Bruce W., Huang, Weixia (Bonnie), Penumarthy, Shashikant & Börner, Katy. (2007). Designing Highly Flexible and Usable Cyberinfrastructures for Convergence. In Bainbridge, William S. & Roco, Mihail C. (Eds.), Progress in Convergence - Technologies for Human Wellbeing (Vol. 1093, pp. 161-179), Annals of the New York Academy of Sciences, Boston, MA.
Project Details Investigators: Katy Börner, Albert-Laszlo Barabasi, Santiago Schnell, Alessandro Vespignani & Stanley Wasserman, Eric Wernert Software Team: Lead: Micah Linnemeier Members: Patrick Phillips, Russell Duhon, Tim Kelley & Ann McCranie Previous Developers: Weixia (Bonnie) Huang, Bruce Herr, Heng Zhang, Duygu Balcan, Bryan Hook, Ben Markines, Santo Fortunato, Felix Terkhorn, Ramya Sabbineni, Vivek S. Thakre & Cesar Hidalgo Goal: Develop a large-scale network analysis, modeling and visualization toolkit for physics, biomedical, and social science research. Amount: $1,120,926, NSF IIS-0513650 award Duration: Sept. 2005 - Aug. 2009 Website: http://nwb.slis.indiana.edu
Project Details (cont.) NWB Advisory Board: James Hendler (Semantic Web) http://www.cs.umd.edu/~hendler/ Jason Leigh (CI) http://www.evl.uic.edu/spiff/ Neo Martinez (Biology) http://online.sfsu.edu/~webhead/ Michael Macy, Cornell University (Sociology) http://www.soc.cornell.edu/faculty/macy.shtml Ulrik Brandes (Graph Theory) http://www.inf.uni-konstanz.de/~brandes/ Mark Gerstein, Yale University (Bioinformatics) http://bioinfo.mbb.yale.edu/ Stephen North (AT&T) http://public.research.att.com/viewPage.cfm?PageID=81 Tom Snijders, University of Groningen http://stat.gamma.rug.nl/snijders/ Noshir Contractor, Northwestern University http://www.spcomm.uiuc.edu/nosh/
CIShell – Serving Non-CS Algorithm Developers & Users Users Developers IVC Interface CIShell Wizards CIShell NWB Interface
CIShell – Builds on OSGi Industry Standard CIShell is built upon the Open Services Gateway Initiative (OSGi) Framework. OSGi (http://www.osgi.org) is • A standardized, component oriented, computing environment for networked services. • Successfully used in the industry from high-end servers to embedded mobile devices since 8 years. • Alliance members include IBM (Eclipse), Sun, Intel, Oracle, Motorola, NEC and many others. • Widely adopted in open source realm, especially since Eclipse 3.0 that uses OSGi R4 for its plugin model. Advantages of Using OSGi • Any CIShell algorithm is a service that can be used in any OSGi-framework based system. • Using OSGi, running CIShells/tools can connected via RPC/RMI supporting peer-to-peer sharing of data, algorithms, and computing power. Ideally, CIShell becomes a standard for creating OSGi Services for algorithms.
NWB Tool: Supported Data Formats Personal Bibliographies • Bibtex (.bib) • Endnote Export Format (.enw) Data Providers • Web of Science by Thomson Scientific/Reuters (.isi) • Scopus by Elsevier (.scopus) • Google Scholar (access via Publish or Perish save as CSV, Bibtex, EndNote) • Awards Search by National Science Foundation (.nsf) Scholarly Database (all text files are saved as .csv) • Medline publications by National Library of Medicine • NIH funding awards by the National Institutes of Health (NIH) • NSF funding awards by the National Science Foundation (NSF) • U.S. patents by the United States Patent and Trademark Office (USPTO) • Medline papers – NIH Funding Network Formats • NWB (.nwb) • Pajek (.net) • GraphML (.xml or .graphml) • XGMML (.xml) Burst Analysis Format • Burst (.burst) Other Formats • CSV (.csv) • Edgelist (.edge) • Pajek (.mat) • TreeML (.xml)
NWB Tool: Output Formats • NWB tool can be used for data conversion. Supported output formats comprise: • CSV (.csv) • NWB (.nwb) • Pajek (.net) • Pajek (.mat) • GraphML (.xml or .graphml) • XGMML (.xml) • GUESS Supports export of images into common image file formats. • Horizontal Bar Graphs saves out raster and ps files.
“Open Code for S&T Assessment” Branded OSGi/CIShell based tool with NWB plugins and many new plugins. Börner, Katy, Huang, Weixia (Bonnie), Linnemeier, Micah, Duhon, Russell Jackson, Phillips, Patrick, Ma, Nianli, Zoss, Angela, Guo, Hanning & Price, Mark. (2009). Rete-Netzwerk-Red: Analyzing and Visualizing Scholarly Networks Using the Scholarly Database and the Network Workbench Tool. Proceedings of ISSI 2009: 12th International Conference on Scientometrics and Informetrics, Rio de Janeiro, Brazil, July 14-17 . Vol. 2, pp. 619-630. Sci2 Toolhttp://sci.slis.indiana.edu GUESS Network Vis Sci Maps Horizontal Time Graphs
Sci2 Tool Geo Maps Circular Hierarchy
Sci2 Tool: Algorithms See https://nwb.slis.indiana.edu/community Preprocessing Extract Top N% Records Extract Top N Records Normalize Text Slice Table by Line --------------------------------------------- Extract Top Nodes Extract Nodes Above or Below Value Delete Isolates --------------------------------------------- Extract top Edges Extract Edges Above or Below Value Remove Self Loops Trim by Degree MST-Pathfinder Network Scaling Fast Pathfinder Network Scaling --------------------------------------------- Snowball Sampling (in nodes) Node Sampling Edge Sampling --------------------------------------------- Symmetrize Dichotomize Multipartite Joining --------------------------------------------- Geocoder --------------------------------------------- Extract ZIP Code Modeling Random Graph Watts-Strogatz Small World Barabási-Albert Scale-Free TARL Analysis Network Analysis Toolkit (NAT) Unweighted & Undirected Node Degree Degree Distribution --------------------------------------------- K-Nearest Neighbor (Java) Watts-Strogatz Clustering Coefficient Watts Strogatz Clustering Coefficient over K --------------------------------------------- Diameter Average Shortest Path Shortest Path Distribution Node Betweenness Centrality --------------------------------------------- Weak Component Clustering Global Connected Components --------------------------------------------- Extract K-Core Annotate K-Coreness --------------------------------------------- HITS Weighted & Undirected Clustering Coefficient Nearest Neighbor Degree Strength vs Degree Degree & Strength Average Weight vs End-point Degree Strength Distribution Weight Distribution Randomize Weights --------------------------------------------- Blondel Community Detection --------------------------------------------- HITS Unweighted & Directed Node Indegree Node Outdegree Indegree Distribution Outdegree Distribution --------------------------------------------- K-Nearest Neighbor Single Node in-Out Degree Correlations --------------------------------------------- Dyad Reciprocity Arc Reciprocity Adjacency Transitivity --------------------------------------------- Weak Component Clustering Strong Component Clustering ---------------------------------------------
Sci2 Tool: Algorithms cont.See https://nwb.slis.indiana.edu/community -------------------------------- Extract K-Core Annotate K-Coreness -------------------------------- HITS PageRank Weighted & Directed HITS Weighted PageRank Textual Burst Detection Visualization GnuPlot GUESS Image Viewer --------------------------------------------- Radial Tree/Graph (prefuse alpha) Radial Tree/Graph with Annotation (prefuse beta) Tree View (prefuse beta) Tree Map (prefuse beta) Force Directed with Annotation (prefuse beta) Fruchterman-Reingold with Annotation (prefuse beta) --------------------------------------------- DrL (VxOrd) Specified (prefuse beta) --------------------------------------------- Horizontal Line Graph Circular Hierarchy Geo Map (Circle Annotation Style) Geo Map (Colored-Region Annotation Style) *Science Map (Circle Annotation) Scientometrics Remove ISI Duplicate Records Remove Rows with Multitudinous Fields Detect Duplicate Nodes Update Network by Merging Nodes --------------------------------------------- Extract Directed Network Extract Paper Citation Network Extract Author Paper Network --------------------------------------------- Extract Co-Occurrence Network Extract Word Co-Occurrence Network Extract Co-Author Network Extract Reference Co-Occurrence (Bibliographic Coupling) Network --------------------------------------------- Extract Document Co-Citation Network * Requires permission from UCSD General Network extraction All four+ save into Postscript files.
Temporal: Horizontal Bargraphs Area size equals numerical value, e.g., award amount. Text, e.g., title Start date End date
CIShell/OSGi is at the core of different CIs and a total of 169 unique plugins are used in the - Information Visualization (http://iv.slis.indiana.edu), - Network Science (NWB Tool) (http://nwb.slis.indiana.edu), - Scientometrics and Science Policy (Sci2 Tool) (http://sci.slis.indiana.edu), and - Epidemics (http://epic.slis.indiana.edu) research communities. Most interestingly, a number of other projects recently adopted OSGi and one adopted CIShell: Cytoscape (http://www.cytoscape.org) lead by Trey Ideker, UCSD is an open source bioinformatics software platform for visualizing molecular interaction networks and integrating these interactions with gene expression profiles and other state data (Shannon et al., 2002). Taverna Workbench (http://taverna.sourceforge.net) lead by Carol Goble, University of Manchester, UK is a free software tool for designing and executing workflows (Hull et al., 2006). Taverna allows users to integrate many different software tools, including over 30,000 web services. MAEviz (https://wiki.ncsa.uiuc.edu/display/MAE/Home) managed by Shawn Hampton, NCSA is an open-source, extensible software platform which supports seismic risk assessment based on the Mid-America Earthquake (MAE) Center research. TEXTrend (http://www.textrend.org) lead by George Kampis, Eötvös University, Hungary develops a framework for the easy and flexible integration, configuration, and extension of plugin-based components in support of natural language processing (NLP), classification/mining, and graph algorithms for the analysis of business and governmental text corpuses with an inherently temporal component. As the functionality of OSGi-based software frameworks improves and the number and diversity of dataset and algorithm plugins increases, the capabilities of custom tools will expand. OSGi/CIShell Adoption
The Power of Maps (2005) Science Maps for Economic Decision Makers (2008)The Power of Reference Systems (2006) Science Maps for Science Policy Makers (2009) Science Maps for Scholars (2010) Science Maps as Visual Interfaces to Digital Libraries (2011) Science Maps for Kids (2012) Science Forecasts (2013)The Power of Forecasts (2007) How to Lie with Science Maps (2014) Exhibit has been shown in 72 venues on four continents. Currently at- NSF, 10th Floor, 4201 Wilson Boulevard, Arlington, VA- Wallenberg Hall, Stanford University, CA- Center of Advanced European Studies and Research, Bonn, Germany- Science Train, Germany. Mapping Science Exhibit – 10 Iterations in 10 yearshttp://scimaps.org 30
Bollen, Johan, Herbert Van de Sompel, Aric Hagberg, Luis M.A. Bettencourt, Ryan Chute, Marko A. Rodriquez, Lyudmila Balakireva. 2008. A Clickstream Map of Science. 31
Council for Chemical Research. 2009. Chemical R&D Powers the U.S. Innovation Engine. Washington, DC. Courtesy of the Council for Chemical Research. 32
Illuminated Diagram Display W. Bradford Paley, Kevin W. Boyack, Richard Kalvans, and Katy Börner (2007) Mapping, Illuminating, and Interacting with Science. SIGGRAPH 2007. Questions: • Who is doing research on what topic and where? • What is the ‘footprint’ of interdisciplinary research fields? • What impact have scientists? Contributions: • Interactive, high resolution interface to access and make sense of data about scholarly activity. Large-scale, high resolution prints illuminated via projector or screen. Interactive touch panel. 33
Katy Börner, Network Workbench: A CI-Marketplace for Network Scientists
Debut of 5th Iteration of Mapping Science Exhibit at MEDIA X was on May 18, 2009 at Wallenberg Hall, Stanford University, http://mediax.stanford.edu, http://scaleindependentthought.typepad.com/photos/scimaps 36
Science Maps in “Expedition Zukunft” science train visiting 62 cities in 7 months 12 coaches, 300 m long Opening was on April 23rd, 2009 by German Chancellor Merkel http://www.expedition-zukunft.de 37
This is the only mockup in this slide show. Everything else is available today. Katy Borner: Computational Scientometrics That Informs Science Policy 38
Computational Scientometrics References Börner, Katy, Chen, Chaomei, and Boyack, Kevin. (2003). Visualizing Knowledge Domains. In Blaise Cronin (Ed.), ARIST, Medford, NJ: Information Today, Inc./American Society for Information Science and Technology, Volume 37, Chapter 5, pp. 179-255. http://ivl.slis.indiana.edu/km/pub/2003-borner-arist.pdf Shiffrin, Richard M. and Börner, Katy (Eds.) (2004). Mapping Knowledge Domains. Proceedings of the National Academy of Sciences of the United States of America, 101(Suppl_1). http://www.pnas.org/content/vol101/suppl_1/ Börner, Katy, Sanyal, Soma and Vespignani, Alessandro (2007). Network Science. In Blaise Cronin (Ed.), ARIST, Information Today, Inc./American Society for Information Science and Technology, Medford, NJ, Volume 41, Chapter 12, pp. 537-607. http://ivl.slis.indiana.edu/km/pub/2007-borner-arist.pdf Börner, Katy (2010) Atlas of Science. MIT Press. http://scimaps.org/atlas 39
All papers, maps, cyberinfrastructures, talks, press are linked from http://cns.slis.indiana.edu