Download
1 / 20
200 likes | 335 Vues
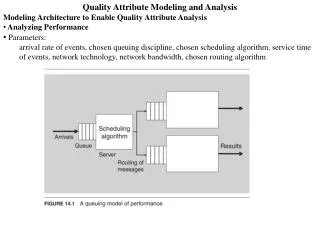
Attribute Interactions in Medical Data Analysis. A . Jakulin 1 , I . Bratko 1,2 , D . Smrke 3 , J . Dem šar 1 , B. Zupan 1,2,4 University of Ljubljana , Slovenia . Jožef Stefan Institute, Ljubljana, Slovenia . Dept. of Traumatology, University Clinical Center, Ljubljana, Slovenia .

E N D
Attribute Interactionsin Medical Data Analysis A. Jakulin1, I. Bratko1,2, D. Smrke3, J. Demšar1, B. Zupan1,2,4 University of Ljubljana, Slovenia. Jožef Stefan Institute, Ljubljana, Slovenia. Dept. of Traumatology, University Clinical Center, Ljubljana, Slovenia. Dept. of Human and Mol. Genetics, Baylor College of Medicine, USA.
Overview • Interactions: • Correlation can be generalized to more than 2 attributes, to capture interactions - higher-order regularities. • Information theory: • A non-parametric approach for measuring ‘association’ and ‘uncertainty’. • Applications: • Automatic selection of informative visualizations uncover previously unseen structure in medical data. • Automatic constructive induction of new features. • Results: • Better predictive models for hip arthroplasty. • Better understanding of the data.
attribute correlation 3-Way Interaction: What is common to A, B and C together; and cannot be inferred from pairs of attributes. 2-Way Interactions Attribute Dependencies label(outcome, diagnosis) C importance of attribute A importance of attribute B A B attribute (feature) attribute (feature)
Entropy given C’s empirical probability distribution (p = [0.2, 0.8]). H(C|A) = H(C)-I(A;C) Conditional entropy --- Remaining uncertainty in C after knowing A. H(A) Information which came with knowledge of A H(AB) Joint entropy I(A;C)=H(A)+H(C)-H(AC) Mutual information or information gain --- How much have A and C in common? Shannon’s Entropy A C
Interaction Information I(A;B;C) := I(AB;C) - I(A;C) - I(B;C) = I(A;B|C) - I(A;B) • Interaction information can be: • NEGATIVE – redundancy among attributes (negative int.) • NEGLIGIBLE – no interaction • POSITIVE – synergy between attributes (positive int.)
History of Interaction Information (Partial) history of independent reinventions: • McGill ‘54 (Psychometrika) - interaction information • Han ‘80 (Information & Control) - multiple mutual information • Yeung ‘91 (IEEE Trans. Inf. Theory) - mutual information • Grabisch & Roubens ‘99 (game theory) - Banzhaf interaction index • Matsuda ‘00 (Physical Review E) - higher-order mutual inf. • Brenner et al. ‘00 (Neural Computation) - average synergy • Demšar ’02 (machine learning) - relative information gain • Bell ‘03 (NIPS02, ICA2003) - co-information • Jakulin ’03 (machine learning) - interaction gain
Utility of Interaction Information • Visualization of interactions in data • Interaction graphs, dendrograms • Construction of predictive models • Feature construction, combination, selection Case studies: • Predicting the success of hip arthroplasty (HHS). • Predicting the contraception method used from demographic data (CMC). Predictive modeling helps us focus only on interactions that involve the outcome.
Interaction Matrix for CMC Domain An attribute’s information gain Illustrates the interaction information for all pairs of attributes. red – positive, blue – negative, green – independent.
Information gain: 100% I(A;C)/H(C) The attribute “explains” 1.98% of label entropy A positive interaction: 100% I(A;B;C)/H(C) The two attributes are in a synergy: treating them holistically may result in 1.85% extra uncertainty explained. A negative interaction: 100% I(A;B;C)/H(C) The two attributes are slightly redundant: 1.15% of label uncertainty is explained by each of the two attributes. Interaction Graphs
uninformative attribute informative attribute information gain Interaction Dendrogram weakly interacting strongly interacting cluster “tightness” loose tight
a weakly negative interaction an unimportant interaction a positive interaction a useless attribute a cluster of negatively interacting attributes Interpreting the Dendrogram
“Bipolar endoprosthesis and short duration of operation significantly increases the chances of a good outcome.” Attribute Structure for HHS “Presence of neurological disease is a high risk factor only in the presence of other complications during operation.” late complications rehabilitation Discovered from data Designed by the physician
A Positive Interaction Both attributes are useless alone, but useful together.They should be combined into a single feature (e.g. with a classification tree, a rule or a Cartesian product attribute).These two attributes are also correlated: correlation doesn’t imply redundancy.
A Negative Interaction very fewinstances! Once we know the wife’s or the husband’s education,the other attribute will not provide much new information. But they do provide some, if you know how to use it! Feature combination may work: feature selection throws data away.
Prediction of HHS Brier score - probabilistic evaluation (K classes, N instances): Models: • Tree-Augmented NBC: 0.227 ± 0.018 • Naïve Bayesian classifier: 0.223 ± 0.014 • General Bayesian net: 0.208 ± 0.006 • Simple feature selection with NBC: 0.196 ± 0.012 • FSS with background concepts: 0.196 ± 0.011 • 10 top interactions → FSS: 0.189± 0.011 • Tree-Augmented NB: 0.207±0.017 • Search for feature comb.: 0.185 ± 0.012
An attribute’s information These two (not very logical) combinations of features are only worth 0.2% loss in performance. The Best Model The endoprosthesis and operation duration interaction provides little information that wouldn’t already be provided by these attributes: it interacts negativelywith the model.
cause effect moderator A Causal Diagram loss of consciousness pulmonary disease sitting ability late luxation injury operation time HHS luxation diabetes neurological disease hospitalization duration
Summary • Visualization methods attempt to: • Summarize the relationships between attributes in data (interaction graph, interaction dendrogram, interaction matrix). • Assist the user in exploring the domain and constructing classification models (interactive interaction analysis). • What to do with interactions: • Do make use of interactions! (rules, trees, dependency models) • Myopia: naïve Bayesian classifier, linear SVM, perceptron, feature selection, discretization. • Do not assume an interaction when there isn’t one! • Fragmentation: classification trees, rules, general Bayesian networks, TAN.