Download
1 / 14
140 likes | 321 Vues
De Weibull verdeling. Weibull:. Waloddi Weibull (1887-1979) A Statistical Distribution Function of Wide Applicability Journal of Applied Mechanics (1951). '' ... may sometimes render good service''. '' ... test it empirically and stick to it as long as none better has been found''.

E N D
De Weibull verdeling • Weibull: • Waloddi Weibull (1887-1979) • A Statistical Distribution Function of Wide Applicability • Journal of Applied Mechanics (1951) • '' ... may sometimes render good service'' • '' ... test it empirically and stick to it as long as none better has been found'' weibull verdeling.ppt
Voorbeelden • Verdeling van: • Levensduren • De tijd tot ... • Gebruiksduur consumentenproduct tot vervanging door nieuw • Temperatuur spoelwater • Veel andere variabelen ( >0 ) • Kansmodel bruikbaar: • In bovenstaande gevallen • Bij waarnemingen in de vorm 'is groter dan' • Als het model past weibull verdeling.ppt
Levensduur verdeling • Uitvalkans F(t) = P(xt) • x = tijd tot de 1e fout • Overlevingskans R(t) = P(x>t) weibull verdeling.ppt
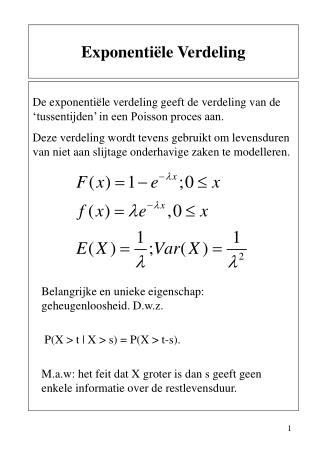
-(t/) F(t)= 1- e Weibull verdelingen • 2-parameters = karakterstieke levensduur = vormgetal • =1 : Negatief exponentiële verdeling • =2 : Rayleigh verdeling • 3 < < 3.6 : lijkt op Normale verdeling • =3.6 : gemiddelde is gelijk aan Mediaan weibull verdeling.ppt
Maximum Likelihood schattingen en Parameters schatten • 2-parameter Weibull verdeling W(,) • Grafische schattingen graf en graf • de beste (statistische) eigenschappen • basis voor betrouwbaarheidsuitspraken • computerprogramma nodig: weibull-2par.xls • Kleinste kwadraten schattingen ' en ' • d.m.v. regressie van log t op loglog(1/F(t)) • minder goed dan bovenstaande weibull verdeling.ppt
Weibull verdeeld? • Probability plot • waarschijnlijkheidspapier • cumulatieve verdeling uitzetten tegen de variabele • voor elke kansverdeling mogelijk • meerdere mogelijkheden • Weibull verdeling • Normale verdeling • rechte lijn? weibull verdeling.ppt
i (i-0.3) 1 517 1 x100% (n+0.4) 2 182 2 3 297 3 4 519 4 5 319 5 6 263 6 7 730 7 8 418 8 9 244 9 n=9 trekkingen uit W(,) nr ti F(ti) = nr t 2 182 7.4% 9 244 18.1 6 263 28.7 3 297 39.4 5 319 50.0 8 418 60.6 1 517 71.3 4 519 81.9 7 730 92.6 weibull verdeling.ppt
(i-0.3) x 100% (n+0.4) Weibull probability plot (1) • vertikaal: kans • horizontaal: variabele t 1e punt: t=182, F(t)=7.4% • rechte lijn? weibull verdeling.ppt
-(t/) F(t)= 1- e Weibull probability plot (2) t = tijd tot fout F(t) = P[ t < t ] graf = 450 graf = 2.4 Onder de 100: F(100) = 1 - exp[-(100/450)2.4] = 0.027 weibull verdeling.ppt
( 1 + n – rangnummer vorige uitvaltijd ) r = ( 1 + aantal units na schorsing nog in test ) Voortgezette schorsingen (1) - 5 uitvallers { 1059, 1093, 1531, 2415, 3042 } - 3 schorsingen { 763, 1161, 2269 } • n=8 units in levensduurtest F(ti) = weibull verdeling.ppt
Voortgezette schorsingen (2) • n=8 • 5 uitvallers, • dus 5 punten graf = 2390 graf = 2.4 weibull verdeling.ppt
label f cum i F(t) koud lauw handwarm warm heet 2 5 5 2 7 2 7 12 14 21 1.5 5.0 10.0 13.5 18.0 5.6 22.0 45.3 61.7 82.7 (i-0.3) F(t) = x 100% (n+0.4) Plot van frequentieverdeling • temperatuur spoelwater t 12 25 38 50 65 i = gem. rangnummer weibull verdeling.ppt
-(t/) F(t)= 1- e Temperatuur Spoelwater (Weibull) t = temperatuur spoelwater graf = 50 graf = 2.0 Evt. normale verdeling: zie volgende blad weibull verdeling.ppt
t = 42.6 0 20 40 60 80 100 Temperatuur spoelwater (normaal) • graf= 43 • graf = (64-22)/2 = 21.0 Uit frequentieverdeling: • f.t = 894 f.t2 = 45208 s = 18.91 weibull verdeling.ppt