Download
1 / 21
210 likes | 215 Vues
This lecture covers the basics of I/O, disk systems, RAID, and the bus design. Topics discussed include I/O overview, memory-mapped I/O, polling vs interrupt-driven, direct memory access (DMA), role of I/O, magnetic disks, disk latency, reliability and availability, and RAID systems.

E N D
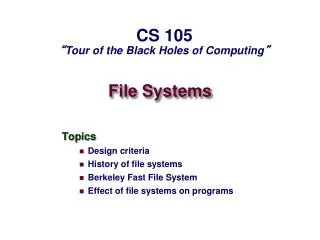
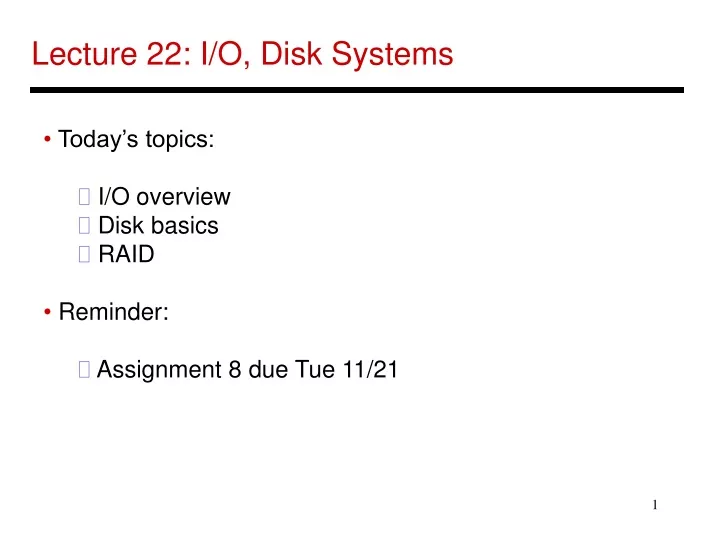
Lecture 22: I/O, Disk Systems • Today’s topics: • I/O overview • Disk basics • RAID • Reminder: • Assignment 8 due Tue 11/21
Input/Output CPU Cache Bus Memory Disk Network USB DVD …
I/O Hierarchy CPU Cache Disk Memory Bus Memory I/O Controller I/O Bus Network USB DVD …
Intel Example P4 Processor System bus 800 MHz, 604 GB/sec Graphics output Memory Controller Hub (North Bridge) Main Memory 2.1 GB/sec DDR 400 3.2 GB/sec 1 Gb Ethernet 266 MB/sec 266 MB/sec Serial ATA 150 MB/s I/O Controller Hub (South Bridge) CD/DVD Disk 100 MB/s Tape 100 MB/s USB 2.0 60 MB/s
Bus Design • The bus is a shared resource – any device can send • data on the bus (after first arbitrating for it) and all other • devices can read this data off the bus • The address/control signals on the bus specify the • intended receiver of the message • The length of the bus determines its speed (hence, a • hierarchy makes sense) • Buses can be synchronous (a clock determines when each • operation must happen) or asynchronous (a handshaking • protocol is used to co-ordinate operations)
Memory-Mapped I/O • Each I/O device has its own special address range • The CPU issues commands such as these: sw [some-data] [some-address] • Usually, memory services these requests… if the address is in the I/O range, memory ignores it • The data is written into some register in the appropriate I/O device – this serves as the command to the device
Polling Vs. Interrupt-Driven • When the I/O device is ready to respond, it can send an • interrupt to the CPU; the CPU stops what it was doing; • the OS examines the interrupt and then reads the data • produced by the I/O device (and usually stores into memory) • In the polling approach, the CPU (OS) periodically checks • the status of the I/O device and if the device is ready with • data, the OS reads it
Direct Memory Access (DMA) • Consider a disk read example: a block in disk is being • read into memory • For each word, the CPU does a • lw [destination register] [I/O device address] and a • sw [data in above register] [memory-address] • This would take up too much of the CPU’s time – hence, • the task is off-loaded to the DMA controller – the CPU • informs the DMA of the range of addresses to be copied • and the DMA lets the CPU know when it is done
Role of I/O • Activities external to the CPU are typically orders of • magnitude slower • Example: while CPU performance has improved by 50% • per year, disk latencies have improved by 10% every year • Typical strategy on I/O: switch contexts and work on • something else • Other metrics, such as bandwidth, reliability, availability, • and capacity, often receive more attention than performance
Magnetic Disks • A magnetic disk consists of 1-12 platters (metal or glass • disk covered with magnetic recording material on both • sides), with diameters between 1-3.5 inches • Each platter is comprised of concentric tracks (5-30K) and • each track is divided into sectors (100 – 500 per track, • each about 512 bytes) • A movable arm holds the read/write heads for each disk • surface and moves them all in tandem – a cylinder of data • is accessible at a time
Disk Latency • To read/write data, the arm has to be placed on the • correct track – this seek time usually takes 5 to 12 ms • on average – can take less if there is spatial locality • Rotational latency is the time taken to rotate the correct • sector under the head – average is typically more than • 2 ms (15,000 RPM) • Transfer time is the time taken to transfer a block of bits • out of the disk and is typically 3 – 65 MB/second • A disk controller maintains a disk cache (spatial locality • can be exploited) and sets up the transfer on the bus • (controller overhead)
Defining Reliability and Availability • A system toggles between • Service accomplishment: service matches specifications • Service interruption: service deviates from specs • The toggle is caused by failures and restorations • Reliability measures continuous service accomplishment • and is usually expressed as mean time to failure (MTTF) • Availability measures fraction of time that service matches • specifications, expressed as MTTF / (MTTF + MTTR)
RAID • Reliability and availability are important metrics for disks • RAID: redundant array of inexpensive (independent) disks • Redundancy can deal with one or more failures • Each sector of a disk records check information that allows • it to determine if the disk has an error or not (in other words, • redundancy already exists within a disk) • When the disk read flags an error, we turn elsewhere for • correct data
RAID 0 and RAID 1 • RAID 0 has no additional redundancy (misnomer) – it • uses an array of disks and stripes (interleaves) data • across the arrays to improve parallelism and throughput • RAID 1 mirrors or shadows every disk – every write • happens to two disks • Reads to the mirror may happen only when the primary • disk fails – or, you may try to read both together and the • quicker response is accepted • Expensive solution: high reliability at twice the cost
RAID 3 • Data is bit-interleaved across several disks and a separate • disk maintains parity information for a set of bits • For example: with 8 disks, bit 0 is in disk-0, bit 1 is in disk-1, • …, bit 7 is in disk-7; disk-8 maintains parity for all 8 bits • For any read, 8 disks must be accessed (as we usually • read more than a byte at a time) and for any write, 9 disks • must be accessed as parity has to be re-calculated • High throughput for a single request, low cost for • redundancy (overhead: 12.5%), low task-level parallelism
RAID 4 and RAID 5 • Data is block interleaved – this allows us to get all our • data from a single disk on a read – in case of a disk error, • read all 9 disks • Block interleaving reduces thruput for a single request (as • only a single disk drive is servicing the request), but • improves task-level parallelism as other disk drives are • free to service other requests • On a write, we access the disk that stores the data and the • parity disk – parity information can be updated simply by • checking if the new data differs from the old data
RAID 5 • If we have a single disk for parity, multiple writes can not • happen in parallel (as all writes must update parity info) • RAID 5 distributes the parity block to allow simultaneous • writes
RAID Summary • RAID 1-5 can tolerate a single fault – mirroring (RAID 1) • has a 100% overhead, while parity (RAID 3, 4, 5) has • modest overhead • Can tolerate multiple faults by having multiple check • functions – each additional check can cost an additional • disk (RAID 6) • RAID 6 and RAID 2 (memory-style ECC) are not • commercially employed
I/O Performance • Throughput (bandwidth) and response times (latency) • are the key performance metrics for I/O • The description of the hardware characterizes maximum • throughput and average response time (usually with no • queueing delays) • The description of the workload characterizes the “real” • throughput – corresponding to this throughput is an • average response time
Throughput Vs. Response Time • As load increases, throughput increases (as utilization is • high) – simultaneously, response times also go up as the • probability of having to wait for the service goes up: • trade-off between throughput and response time • In systems involving human interaction, there are three • relevant delays: data entry time, system response time, • and think time – studies have shown that improvements • in response time result in improvements in think time • better response time and much better throughput • Most benchmark suites try to determine throughput while • placing a restriction on response times
Title • Bullet