Download
1 / 105
1.05k likes | 1.07k Vues
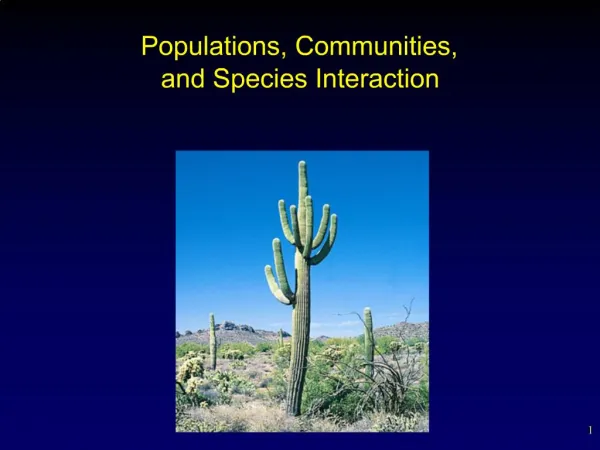
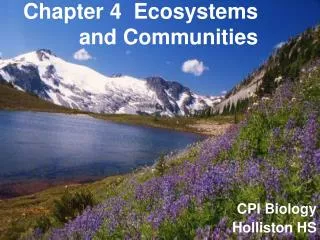
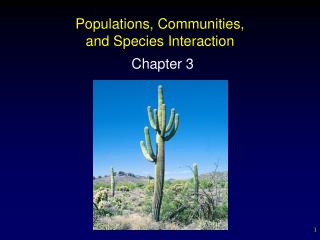
Chapter 4 Populations and Communities. Dynamics of natural populations. Population : a group of members of the same species living in an area Community : populations of different species living together in an area Populations grow with births and immigration

E N D
Dynamics of natural populations • Population: a group of members of the same species living in an area • Community: populations of different species living together in an area • Populations grow with births and immigration • They decline with deaths and emigration (Births + Immigration) – (Deaths + Emigration) = Change in population number
Population growth • Population growth: change in population • Equilibrium: births + immigration are equal to deaths + emigration • Often, population growth is not zero • Population growth rate: amount the population has changed divided by the time it had to change • Population growth curves: graph how populations grow; used to find • How fast a population could grow • How many individuals there are now • What the future population size could be
Population growth curves • Constant population growth rate: adding a constant number of individuals over each time period • The simplest type of growth to model • Is an unlikely pattern and is not generally found in nature • But it’s a good comparison to other growth patterns • Starting with 2 individuals, and a constant growth rate of 2, at the end of 24 weeks you would have 50 individuals Population number at the start + (A constant * Time) = Population number at the end
Exponential growth • Each species can increase its population • With favorable conditions • Exponential increase: does not add a constant number of individuals for each time period • The doubling time remains constant • For example, it takes 2 days to go from 8 to 16 individuals, as well as from 1,000 to 2,000 individuals • Such growth is called an “explosion” • J-curve: the curve of exponential growth
Exponential growth of a population • Carrying capacity (K): the maximum population of a species that a given habitat can support without being degraded • This is the upper limit of population growth
Outcomes of population increase • The population continues to grow and then dies off • Logistic growth: some process slows growth so it levels off near carrying capacity • Results in an S-shaped curve • It levels off at K • As the population approaches K, growth slows • The population remains steady and growth = 0 • The maximum rate of population growth occurs halfway to K
Populations show logistic growth • J-shaped explosions are often followed by crashes • J-shaped growth results from unusual disturbances • Introduction of a foreign species, a suddenly changed habitat, the elimination of a predator, arrival in a new habitat • Other populations show an S-curve • Followed by cycles of lower and higher numbers around K • Or shoot above K, eventually cycling around K
Biotic potential vs. environmental resistance • Biotic potential: the number of offspring (live births, eggs, or plant seeds and spores) produced under ideal situations • Measured by r (the rate at which organisms reproduce) • Varies tremendously from less than 1 birth/year (some mammals) to millions/year (plants, invertebrates)
Biotic potential vs. environmental resistance • Recruitment: survival through early growth stages to become part of the breeding population • Young must survive and reproduce to have any effect on population size
Environmental resistance • Abiotic andbiotic factors cause mortality (death) • Prevents unlimited population growth • Environmental resistance: the biotic and abiotic factors that may limit a population’s increase • Biotic: predators, parasites, competitors, lack of food • Abiotic: unusual temperatures, moisture, light, salinity, pH, lack of nutrients, fire
Environmental resistance • Environmental resistance can also lower reproduction • Loss of suitable habitat, pollution • Changed migratory habits of animals
Reproductive strategies: r-strategists • The interplay of environmental resistance and biotic potential drives the success of two reproductive strategies
r-strategists • r-strategists (r-selected species): produce lots of young, but leave their survival to nature • Results in low recruitment • Rapid reproduction, rapid movement, short life span • Adapted to a rapidly changing environment • “Boom-and-bust” populations • “Weedy” or “opportunistic” species • For example, housefly
Reproductive strategies: K-strategists • K-strategists (K-selected species): lower biotic potential • Care for and protect young • Live in a stable environment already populated by the species • Larger, longer lived, well-adapted to normal environmental fluctuations • Their populations fluctuate around carrying capacity • For example, elephant, California condor
Life histories • Life history: progression of changes in an organism’s life • Age at first reproduction, length of life, etc. • Visualized in a survivorship graph • Type I survivorship: low mortality in early life • Most live the bulk of their life span (e.g., humans) • Type III survivorship: many offspring that die young • Few live to the end of their life (oysters, dandelions) • Type II survivorship: intermediate survivorship pattern (squirrels, coral) • K-strategists have a Type I pattern; r-strategists show Type III
Predictable pattern in species • There is a predictable pattern to the way human activities affect species • r-strategists become pests when humans change an area • Houseflies, dandelions, cockroaches increase • K-strategists become rarer or extinct with change • Eagles, bears, and oaks decline
Why does a population grow? • A population’s size depends on the interplay between its biotic potential and environmental resistance • A population’s biotic potential remains constant • Environmental resistance changes • Population balance is a dynamic balance • Additions (births, immigration) and subtractions (death, emigration) occur continually • The population may fluctuate widely or very little
Limits on populations • The carrying capacity may not explain what limits a population • Population density: number of individuals per unit area • The higher the density, the more likely a factor (e.g., crowding or disease) affects the population
Density dependence and independence • Density-dependent population control: increases with increased population density • Predation, disease, food shortage
Density dependence and independence • Density-independent factor: one whose effects are independent of the density of the population • Spring freeze, fire • Is not involved in maintaining population equilibrium in the logistic growth
Regulating a population • Only density-dependent factors can regulate a population (keep it in equilibrium) • Top-down regulation: control of a population (species) by predation • Bottom-up regulation: control of a population occurs as a result of scarcity of a resource (food)
Critical number • Critical number: the minimum population base allowing the survival and recovery of a population • A pack of wolves, flock of birds, school of fish • The group is necessary to provide protection and support • If a population falls below this number • Surviving members become more vulnerable • Breeding fails • Extinction is almost inevitable
Humans are responsible for biodiversity loss • Human activities are responsible for the decline and extinction of species • Humans change habitats, introduce alien species, pollute, hunt, etc. • The Endangered Species Act calls for recovery of • Threatened species: populations are declining rapidly • Endangered species: populations are near the critical number
Community interactions • Relationships between species may be positive (helpful), negative (harmful), or neutral for each species • Predation: one member benefits, the other is harmed (+−) • Includes parasitism • Competition: both species are harmed (−−) • Interspecific competition: between different species • Intraspecific competition: between the same species • Mutualism: both species benefit (++) • Commensalism: One species benefits, the other is not affected (+0)
Predation • Predator: the organism that does the feeding • Prey: the organism that is fed upon • Predator-prey interaction: carnivores (meat eaters) eat herbivores (plant eaters) • Herbivores feed on plants • Parasites feed on hosts • Parasite: an organism (plant or animal) that feeds on its “prey,” usually without killing it • Host: the organism that is being fed upon
Parasitic organisms • Include tapeworms, disease-causing bacteria, viruses, fungi • Parasites affect host populations in a density-dependent way • Increased population density makes it easier for parasites and their vectors (carriers of the parasite) to find new hosts • Pathogens: bacteria and viruses that cause disease • No real ecological difference from other parasites • Highly specialized parasites
Regulation of prey • Predators can regulate herbivore numbers (top-down control) • Moose crossed to Isle Royale, in Lake Superior • Several years later, wolves also reached the island • Without wolves, the moose population grew rapidly • Low environmental resistance for the moose • When they arrived, the wolf population also increased and preyed on moose • Low environmental resistance for the wolves • Fewer moose (high environmental resistance) resulted in fewer wolves (high environmental resistance)
Other factors affect populations • Wolf predation is not the only factor affecting moose • Deep snow limited access to food • A tick infestation caused significant mortality • A sharp decline in moose keeps wolf populations low • Not enough calves to catch • Wolves can’t catch a mature moose in good condition • Predator-prey relationships involve top-down (on the prey) and bottom-up (on the predator) regulation
Overgrazing • If herbivores eat plants faster than they can grow, plants are depleted and animals eventually suffer • Reindeer were brought to St. Matthew Island • No population can escape the ultimate limitations set by environmental resistance
Predator removal • Eliminating predators upsets plant-herbivore relationships • White-tailed deer in the U.S. were originally controlled by wolves, mountain lion, bears • But these were killed because they were thought to threaten livestock and humans • Deer populations can get so large they overgraze the area • Humans control numbers through hunting
Keystone species • Removal of one species can create a cascade of effects • Impacting far more than just the other species they interact with • Sea stars eat mussels in rocky intertidal zones • Removing sea stars allows mussels to crowd out all other species, reducing diversity • Keystone species: play a crucial role in maintaining ecosystem biotic structure • Moderate other species that would take over • Allow other, less-competitive species to flourish
Competition • Interactions where both species are harmed • They compete for a scarce resource • Species that compete have overlapping niches • Over time, there is pressure to reduce the overlap
Competition • Intraspecific competition: competition between members of the same species • Occurs over resources • Territory: an area defended by an individual or group • Most defense is intimidation—serious fights are rare • Organisms fight to protect an area for nesting, establishing a harem, or food resources
Territoriality as an advantage • It protects a population from the possibility of everyone getting some resources, but nobody getting enough to survive • Without territoriality, when resources are scarce • All members would get only a part of what they need and could die • Competition lowers fitness and production of offspring • Territoriality lowers the direct effects of competition
Not everyone gets a territory • Individuals unable to claim a territory • May disperse, opening new habitats to the species • May die • Territoriality is most likely in K-strategists • An adaptation that helps organisms disperse and stabilizes populations
Impact on the species • Survival of the fittest: one of the forces in nature leading to evolutionary changes in a species • Those individuals in a competing group that can survive and reproduce demonstrate superior fitness to the environment • Every factor of environmental resistance is a selective pressure • Individuals who survive and reproduce have the genetic endowment to better cope with their environment
Interspecific competition • Competitive exclusion principle: species cannot survive competition if they occupy the same niche • But species do occupy the same area without becoming extinct • Abiotic conditions in an environment vary in space and time • Adaptations of species to specific conditions allows it to thrive and overcome its competitors in one location or time, but not in another
Environments are heterogeneous • Competitors in the same habitat have different niches • Woodpeckers eat insects; other birds eat seeds • Space can also be a resource • Resource partitioning: the division of a resource and specialization in different parts of it