Download

1 / 9
360 likes | 1.24k Vues
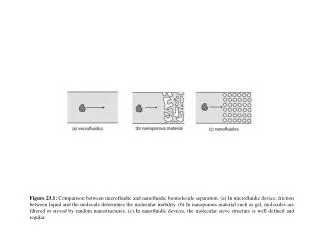
SIEVING. In the final separation operation, restraint is imposed on some of the particles by mechanical screens that prevent their passage. This is done successively, using increasingly smaller screens, to give a series of particles classified into size ranges.

E N D
In the final separation operation, restraint is imposed on some of the particles by mechanical screens that prevent their passage. • This is done successively, using increasingly smaller screens, to give a series of particles classified into size ranges. • The fluid, usually air, can effectively be ignored in this operation which is called sieving. • The material is shaken or agitated above a mesh or cloth screen; particles of smaller size than the mesh openings can pass through under the force of gravity.
Rates of throughput of sieves are dependent upon a number of factors: • nature and the shape of the particles, • frequency and the amplitude of the shaking, • methods used to prevent sticking or bridging of particles in the apertures of the sieve and • tension and physical nature of the sieve material.
Standard sieve sizes have been evolved, covering a range from 25 mm aperture down to about 0.6 mm aperture. • The mesh was originally the number of apertures per inch. • A logical base for a sieve series would be that each sieve size have some fixed relation to the next larger and to the next smaller.
The results of a sieve analysis can be presented in various forms, perhaps the best being the cumulative analysis giving, as a function of the sieve aperture (D), the weight fraction of the powder F(D) which passes through that and larger sieves, irrespective of what happens on the smaller ones. • That is the cumulative fraction sums all particles smaller than the particular sieve of interest.
Thus F = F(D), dF/dD = F ' (D) where F ' (D) is the derivative of F(D) with respect to D. So dF = F '(D)dD and so integrating between D1and D2 gives the cumulative fraction between two sizes D2 (larger) and D1 which is also that fraction passing through sieve of aperture D2 and caught on that of aperture D1. • The F'(D) graph gives a particle size distribution analysis.
EXAMPLE 10.7. Sieve analysis Given the following sieve analysis: Sieve size mm % retained 1.00 0 0.50 11 0.25 49 0.125 28 0.063 8 through 0.063 4 plot a cumulative sieve analysis and estimate the weight fraction of particles of sizes between 0.300 and 0.350 mm and 0.350 and 0.400 mm.
From the above table: Less than aperture (mm) 63 125 250 500 1000 Percentage (cumulative) 4 12 40 89 100 This has been plotted on Fig. 6.1. and the graph F(D) has been smoothed. From this the graph of F'(D) has been plotted, working from that slope of F(D), to give the particle size distribution.