Download
1 / 18

E N D
Chapter 13Titrimetric Methods Titrimetric methods include a large and powerful group of quantitative procedures based on measuring the amount of a reagent of known concentration that is consumed by an analyte. Volumetric titrimetry involves measuring the volume of a solution of known concentration that is needed to react essentially completely with the analyte. Gravimetric titrimetry differs only in that the mass of the reagent is measured instead of its volume. In coulometric titrimetry, the ‘reagent’ is a constant direct electrical current of known magnitude that consumes the analyte.
Defining Some Terms A standard solution (or a standard titrant) is a reagent of known concentration that is used to carry out a titrimetric analysis. A titration is performed by adding a standard solution from a buret or other liquid-dispensing device to a solution of the analyte until the reaction between the two is judged complete. The volume of reagent needed to complete the titration is determined from the difference between the initial and final volume readings. The equivalence point in a titration is reached when the amount of added titrant is chemically equivalent to the amount of analyte in the sample.
Equivalence Points and End Points The equivalence point of a titration cannot be determined experimentally. Instead, we can only estimate its position by observing some physical change associated with the condition of equivalence. This change is called the end point for the titration. Every effort is made to ensure that any volume or mass difference between the equivalence point and the end point is small. Such differences do exist, however, as a result of inadequacies in the physical changes and in our ability to observe them. The difference in volume or mass between the equivalence point and the end point is the titration error.
…continued… Indicators are often added to the analyte solution to give an observable physical change (the end point) at or near the equivalence point. Large changes in the relative concentration of analyte or titrant occur in the equivalence-point region. These concentration changes cause the indicator to change in appearance. Typical indicator changes include the appearance or disappearance of a color, a change in color, or the appearance or disappearance of turbidity.
Primary Standards A primary standard is a highly purified compound that serves as a reference material in all volumetric and mass titrimetric methods. The accuracy of a method is critically dependent on the properties of this compound. Important requirements for a primary standard are 1. High purity 2. Atmospheric stability 3. Absence of hydrate water so that the composition of the solid does not change with variation in relative humidity 4. Ready availability at modest cost 5. Reasonable solubility in the titration medium 6. Reasonably large molar mass so that the relative error associated with weighing the standard is minimized.
Desirable Properties of standard Solutions The ideal standard solution for a titrimetric method will 1. Be sufficiently stable so that it is only necessary to determine its concentration once. 2. React rapidly with the analyte so that the time required between additions of reagent is minimized. 3. React completely with the analyte so that satisfactory end points are realized. 4. Undergo a selective reaction with the analyte that can be described by a balanced equation.
Establishing the Concentration of Standard solutions The accuracy of a titrimetric method can be no better than the accuracy of the concentration of the standard solution used in the titration. Two basic methods are used to establish the concentration of such solutions. The first is the direct method in which a carefully weighed quantity of a primary standard is dissolved in a suitable solvent and diluted to a known volume in a volumetric flask. The second is by standardization in which the titrant to be standardized is use to titrate (1) a weighed quantity of a primary standard, (2) a weighed quantity of a secondary standard, or (3) a measured volume of another standard solution.
Expressing the Concentration of Standard Solutions The concentrations of standard solutions are generally expressed in units of either molarity c or normality cN. The first gives the number of moles of reagent contained in one liter of solution, and the second gives the number of equivalents of reagent in the same volume. M = moles/L N = equivalents/L
Some Useful algebraic Relationships Most volumetric calculations are based on two pairs of fundamental equations that are derived from definitions of millimole, mole, and molar concentration. For the chemical species A, we may write We may derive a second pair from the definition of molar concentration. That is,
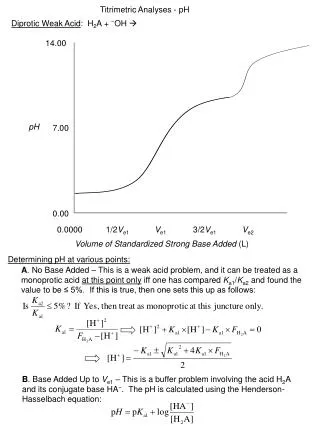
TITRATION CURVES An end point is an observable physical change that occurs near the equivalence point of a titration. The two most widely used end points involve (1) changes in color due to the reagent, the analyte, or an indicator and (2) a change in potential of an electrode that responds to the concentration of the reagent or the anlyte. To understand the detection of end points and the sources of titration errors, we will construct titration curves for the system under consideration. Titration curves consist of a plot of reagent volume on the horizontal axis and some function of the analyte or reagent concentration on the vertical axis.