Download
1 / 24
240 likes | 393 Vues
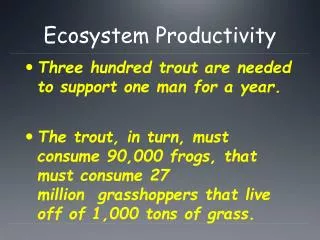
Economic Analysis of Ecosystem Services: The UK Experience Ian Bateman Head of Economics for the UK National Ecosystem Assessment.

E N D
Economic Analysis of Ecosystem Services: The UK Experience Ian Bateman Head of Economics for the UK National Ecosystem Assessment Ian J. Bateman, David Abson, Nicola Beaumont, Amii Darnell, Carlo Fezzi, Nick Hanley, Andreas Kontoleon, David Maddison, Paul Morling, Joe Morris, Susana Mourato, UnaiPascual, Grischa Perino, Antara Sen, DugaldTinch, Kerry Turner, Gregory Valatin, Barnaby Andrews, VivianaAsara, Tom Askew, UzmaAslam, Giles Atkinson, NeshaBeharry-Borg, Katherine Bolt, Murray Collins, Emma Comerford, Emma Coombes, Andrew Crowe, Steve Dugdale, Jo Foden, Steve Gibbons, Roy Haines-Young, Caroline Hattam, Mark Hulme, TizianaLuisetti, George MacKerron, Stephen Mangi, Dominic Moran, Paul Munday, James Paterson, GuilhermeResende, Gavin Siriwardena, Jim Skea, Daan van Soest, MetteTermansen. Presentation to: Wealth Accounting and Valuation of Ecosystem Services (WAVES) Partnership Meeting The World Bank, Washington DC 29-31 March, 2011 THISPRESENTATION DOES NOT NECESSARILY REPRESENT THE FINDINGS OR VIEWS OF THE UK NATIONAL ECOSYSTEM ASSESSMENT Centre for Social & Economic Research on the Global Environment
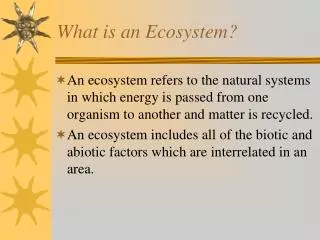
SocialFeedbacks Human wellbeing Values Goods Ecosystems Ecosystem services Biodiversity & physical inputs UK National Ecosystem Assessment (NEA): Overall Conceptual Framework • Drivers of Change • Environmental change (e.g. rainfall, sea level) • Trends (e.g. markets, preferences, demographics) • Policies Future Scenarios for the UK • Social (‘cultural’) • Provisioning • Regulating • Supporting
Other capital inputs Physical and chemical inputs Non-monetised Primary & intermediate processes Weathering £ £ Value of goods... Final ecosystem services Food ..of which ES value Crops, livestock, fish Goods £ £ Primary production Drinking water Water availability £ £ Trees Fibre Decomposition £ £ Peat Energy Soil formation £ £ Wild species diversity Equable climate Nutrient cycling £ £ Waste breakdown £ £ Pollution control Water cycling Detoxification £ £ Purified water Flood control £ £ Climate regulation Local climate Disease control £ £ Stabilising vegetation Pollination £ £ Natural medicine Natural enemies £ £ Evolutionary processes £ Meaningful places £ Wild species diversity £ Ecological interactions £ Cultural Millennium Assessment categories Provisioning From ecosystem services to their value Regulating Supporting ES contribution to well-being ☺ ☺ ☺ ☺ ☺ ☺ + ☺ ☺ ☺ ☺ ☺ ☺ ☺ Recreation ☺ ☺ Good health
Integrated modelling Natural environment Climate change Market Policy Farm decisions & income (£) Water environment Land use ES value of water (£)
The main drivers of land use change POLICY MARKETS & TECH ENVIRONMENT Set aside rate Output prices Soils NVZ, ESA, Parks, etc. Input costs Temperature Milk quota Technology Rainfall
Data • We assemble Agricultural Census data for every 2km grid square, for all of England and Wales from 1969 to 2004 and combine this with over 50,000 farm years of data from the Farm Business Survey. This gives: • Agricultural land use hectares (wheat, barley, grass, etc.); • Livestock numbers (dairy, beef, sheep, etc) • Time trends (response times, new crops, etc.) • We then add • Environmental and climatic variables (rainfall, temperature, machinery working days, field capacity, etc.); • Policy determinants (NVZ, NSA, ESA, Parks, etc.) • Input and output prices for the period
Modeling land use decisions Based on a joint (in inputs) multi-activity farm profit function Profits = f (output price, input price; farm size; farm physical environment; etc.) • Cereals • Oilseed rape • Root crops • Temporary grassland • Permanent grassland • Rough grazing • Dairy cattle • Beef cattle • Sheep • Other farm land (farm woodland, etc.) > 88% of total agricultural land Activities modelled:
The area of cereals is a function of: • Market forces • Policy • Local physical environment and environmental change
Validation: Actual versus predicted tests Cereals Temporary grassland
Climate change impacts Rainfall: 2004 - 2040 Temperature: 2004 - 2040
-710 - -100 -400 - -30 -100 - -20 -30 - -12 -20 - 20 -12 - 12 20- 80 12- 30 80- 200 30- 70 Predicted land use changes due to climate change: e.g. Dairy vs. Oilseed rape • Dairy 2004-2040 2004-2060 2004-2020 Oilseed rape 2004-2040 2004-2060 2004-2020
Predicted change in farm gross margin due to climate change 2004-2050 UKCIP low emissions scenario UKCIP high emissions scenario
Land use change & water quality Nitrate leaching per month Integrated modelling: Linking land use with diffuse water pollution Modelling the impacts of land use change on river water quality and ecosystems services - and how water policies like WFD forces land use to change
What reduces chlorophyll-a concentrations in rivers? • Less root crops • Less dairy cows • Less suspended sediment • Higher river flows • Lower water temperature • Higher rainfall But do the public value changes in river water quality? And if so....by how much?
Valuation methods 1: Stated preference (contingent valuation; choice experiments; etc.) ALTERNATIVE STATUS QUO (improvement B) (improvement A) WATER BILL + £ X SAME WATER BILL Looking at more than one change shows how the value of each successive improvement diminishes. This avoids overstating the value of multiple improvements Spatially dispersed sampling to capture real world variation in the availability and quality of the improvement site and substitutes
Enhancing understanding using virtual reality Valuation methods 1: Stated preference (contingent valuation; choice experiments; etc.) Which do you prefer? No change in water bill £ X increase in water bill
Valuation methods 2: Revealed preference Valuing water recreation • Survey of a diverse sample of over 2,000 households across a wide area with variable water quality (enhances transferability) • For each respondent: Home located • Locate visited sites • Characterise water quality (e.g. EA data) • Record visit frequency • Identify all possible sites (including zero visit sites) • GIS generated measures of travel time • Travel cost model of the trade-off between visit frequency, visit cost and water quality • Estimate the value individuals have for changes in water quality (8 visits) (1 visit) (1 visit) (4 visits) (1 visit) £
What encourages people to visit rivers? • Near to home • Other tourist attractions on site • Nearby pubs and car parks • Far from sewage works and industry • Few other substitutes available • And... • High water quality
Marginal WTP Water quality (WFD categories) Yellow (poor) Green (good) Red (dreadful) Blue (pristine)
Integrated modelling case study 2. Combating land use change impacts on water quality
Spatial distribution of water quality change values WFD improvements Climate change disutility
www.valuing-nature.net Founding partners and funders
Economic Analysis of Ecosystem Services: The UK Experience Ian Bateman Head of Economics for the UK National Ecosystem Assessment Ian J. Bateman, David Abson, Nicola Beaumont, Amii Darnell, Carlo Fezzi, Nick Hanley, Andreas Kontoleon, David Maddison, Paul Morling, Joe Morris, Susana Mourato, UnaiPascual, Grischa Perino, Antara Sen, DugaldTinch, Kerry Turner, Gregory Valatin, Barnaby Andrews, VivianaAsara, Tom Askew, UzmaAslam, Giles Atkinson, NeshaBeharry-Borg, Katherine Bolt, Murray Collins, Emma Comerford, Emma Coombes, Andrew Crowe, Steve Dugdale, Jo Foden, Steve Gibbons, Roy Haines-Young, Caroline Hattam, Mark Hulme, TizianaLuisetti, George MacKerron, Stephen Mangi, Dominic Moran, Paul Munday, James Paterson, GuilhermeResende, Gavin Siriwardena, Jim Skea, Daan van Soest, MetteTermansen. Presentation to: Wealth Accounting and Valuation of Ecosystem Services (WAVES) Partnership Meeting The World Bank, Washington DC 29-31 March, 2011 THISPRESENTATION DOES NOT NECESSARILY REPRESENT THE FINDINGS OR VIEWS OF THE UK NATIONAL ECOSYSTEM ASSESSMENT Centre for Social & Economic Research on the Global Environment