Download
1 / 18
180 likes | 305 Vues
Envisat: Near Real Time Processing and Oceanography. Envisat CCVT Meeting. Kirk Whitmer Gregg Jacobs JE Sverdrup/NRL Stennis Space Center, MS, USA. ALPS and ODDITIES. ALPS : Near real time data processing system Data is quality checked at each step and suspect data is flagged

E N D
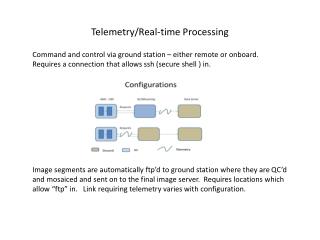
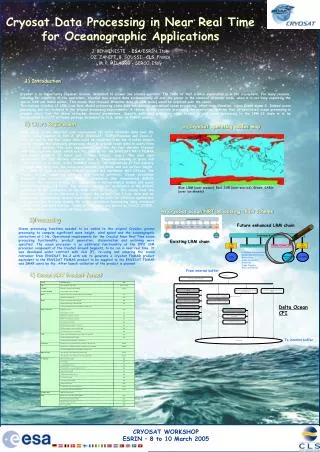
Envisat: Near Real Time Processing and Oceanography Envisat CCVT Meeting Kirk Whitmer Gregg Jacobs JE Sverdrup/NRL Stennis Space Center, MS, USA
ALPS and ODDITIES • ALPS: Near real time data processing system • Data is quality checked at each step • and suspect data is flagged • Must err on the side of caution because of • subsequent subsystems • Run daily at NRL and NAVO • ODDITIES: Graphical data analysis system • Results displayed on The Real Time Ocean Environment website • www.ocean.nrlssc.navy.mil/altimetry • Run daily at NRL Envisat imar data fed into the systems…
read: data is read from gdrs into ALPS format • Smooth electromagnetic bias and • wet troposphere along track • Apply correction terms to height: • Wet troposphere, Dry troposphere • Inverse barometer, Solid tide • Ionosphere, Electromagnetic bias • Check for minimum number of high rate values (>15) • Check flag for water (sea ice?)
Ionosphere drop plot Ku band correction only Doris Ku band correction only All ionosphere corrections applied: Ku band correction Doris Ku band correction Model Ku band correction
interp: data is interpolated to reference ground tracks • Minimum number of points needed to interpolate • Interpolation incorporates the geoid gradient • Along track smoothing
Data too sparse to interpolate to ground tracks • Single largest contributor to “dropped” data points
aptide:tides are removed • got00.2 tide model applied • No points are dropped
orbgem:orbit correction calculated and applied • Long term mean and climactic mean removed • Iterative sinusoidal fit calculation • Return means • Apply correction based on fit
Orbit correction magnitude Mean: 60.7 cm RMS: 74.0 cm
apply: mean removed • Along track “box car” filter • Sanity checks
Sea ice issue? High latitude makes ice more important Detection algorithm or flag desireable SSH anomaly plot suggests many sea ice points remaining
ERS-2 GFO
Jason-1 • Multiple causes for ice point drops • Lower latitude reduces importance
Percent data utilized Jason (osdr) 84.73/85.20 % Jason (igdr) 90.17/90.17 % Ers-2 84.22/90.26 % GFO (doppler) 87.49/87.49 % GFO (laser) 90.30/90.30 %
Sea Surface Height Anomaly 14 October 2002
Altimeter cross track intercomparisons • High latitude values sea ice influenced