Download
1 / 19
280 likes | 674 Vues
Capnography in ICU. Shari McKeown, RRT. Mainstream sensor displays real-time, continuous carbon dioxide level throughout the respiratory cycle by measuring absorption of infrared light by CO 2 molecules. Overview.

E N D
Capnography in ICU Shari McKeown, RRT
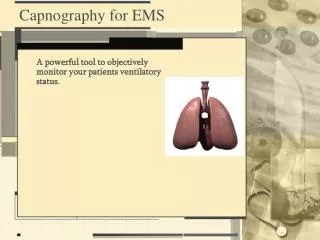
Mainstream sensor displays real-time, continuous carbon dioxide level throughout the respiratory cycle by measuring absorption of infrared light by CO2 molecules Overview
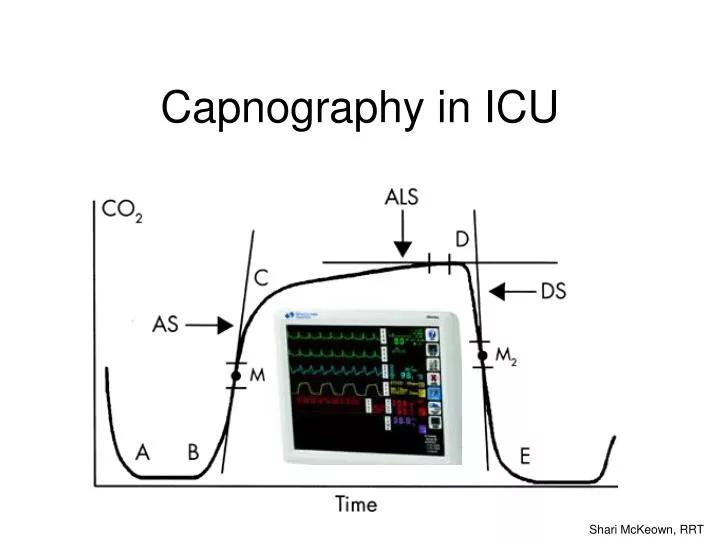
C-D alveolar gas, high CO2 with upward slope due to continuing CO2 production and emptying of all alveolar units D end-tidal CO2. The highest CO2 value at end-expiration A-B exhalation begins - anatomical and ETT deadspace, no CO2 B-C exhalation continues - anatomical deadspace mixed with alveolar gas, increasing CO2 D-E inspiration begins, CO2 rapidly drops E-A inspired gas contains no CO2 What does the waveform mean?
Why does the CO2 level always slope upwards to end-tidal? • As expiration progresses, basal lung units empty last – these contain a higher CO2 level (lower V/Q ratio) • CO2 production continues throughout expiration, resulting in a higher CO2 at the end of the breath www.capnography.com Bhavani Shankar Kodali MD
What increases PETCO2? • Increased CO2 Production • Increased metabolic rate • Fever • Seizures • Shivering • Pain • Bicarbonate infusion • Increased delivery of CO2 to lungs • Increased cardiac output • Hypertension • Reduced clearance of CO2 from lungs • Hypoventilation • Mainstem bronchus intubation (ETT in one lung) • Partial airway obstruction
What decreases PETCO2? • Decreased CO2 Production • Decreased metabolic rate • Hypothermia • Analgesia • Sedation • Decreased delivery of CO2 to lungs • Decreased cardiac output • Hypotension • Hypovolemia • Pulmonary Embolism • Cardiac Arrest • Rapid clearance of CO2 from lungs • Hyperventilation • No communication with alveolar gas • Total airway obstruction • Accidental tracheal extubation • Apnea • Increased alveolar deadspace • High PEEP • Technical Errors • Circuit disconnection • Leaks
Cardiac Output • Decreasing cardiac output will reduce pulmonary blood flow, causing a decrease in alveolar perfusion and increased alveolar deadspace • A higher alveolar deadspace will result in lower ETCO2 values and higher Pa-ETCO2 gradient. • Under conditions of constant lung ventilation, ETCO2 can be used as a monitor of pulmonary blood flow. www.capnography.com Bhavani Shankar Kodali MD
CPR • During CPR, blood flow to the lungs is low and few alveoli are perfused • Tidal volumes delivered with a resuscitation bag tend to be large, high deadspace results in PETCO2 is low • If the blood flow to the lungs improves, more alveoli are perfused and PETCO2 will increase • C02 presentation to the lungs is the major limiting determinant of PETCO2 and it has been found that PETCO2 correlates well with measured cardiac output during resuscitation • Therefore PETCO2 can be used to judge the effectiveness of resuscitative attempts • PETCO2 has a prognostic significance. It has been observed that non-survivors had lower PETCO2 during CPR than survivors.
How does PETCO2correlate with PaCO2? • Normal gradient of (a-ET)PCO2 is 2-5 mmHg, and will increase with age • This is due to normal ventilation/perfusion (V/Q) mismatching throughout the lung • An increased gradient reflects increased deadspace - alveoli that are ventilated but not perfused will have low CO2; when exhalation occurs, this results in a higher Pa-ETCO2 gradient • Pa-ETCO2 gradient will decrease in pregnancy reflecting the higher cardiac output and pulmonary perfusion in the pregnant patient • PETCO2 should always be recorded when ABG’s are taken to trend the Pa-ETCO2 gradient Record hourly Record when ABG drawn
How can you use Pa-ETCO2 gradient for PEEP titration? • Pa-ETCO2 gradient is a good reflection of alveolar deadspace • When V/Q is at its best (optimum PEEP) the Pa-ETCO2 gradient is low. Oxygenation should be optimal. • As the level of PEEP is increased beyond this, alveolar deadspace increases, the Pa-ETPC02 increases, and oxygenation worsens. • Pa-ETC02 can be used as a sensitive indicator to titrate PEEP in patients with early ARDS or with alveolar edema
What information can you get by looking at the waveform? • The shape of a capnogram is identical in all humans with healthy lungs. Any deviations in shape must be investigated to determine a physiological or a pathological cause of the abnormality Normal waveform www.capnography.com Bhavani Shankar Kodali MD
Slanting of upstroke • Occurs when there is obstruction to expiratory gas flow • e.g. asthma, bronchospasm, obstructive pulmonary disease, and kinked endotracheal tube Normal Airway obstruction www.capnography.com Bhavani Shankar Kodali MD
Patient Efforts • A sudden decrease during expiratory phase indicates spontaneous patient effort • Waveform can be used to identify missed ventilator triggers that lead to patient-ventilator asynchrony Normal Patient Effort www.capnography.com Bhavani Shankar Kodali MD
Cardiac Oscillations • Ripple during expiratory phase indicate small movements in alveolar gas • Caused by cardiac or aortic pulsations against alveoli Normal Cardiac Oscillations www.capnography.com Bhavani Shankar Kodali MD
Heterogeneous Lung Pathology • Lungs with differing compliance/resistances (e.g. single-lung transplant) will have different empyting rates, CO2 clearance times, and V/Q ratios • May result in dual-peak or dual-slope waveforms Normal Heterogenous V/Q ratios www.capnography.com Bhavani Shankar Kodali MD
Waveform Trends • Hypoventilation or patient fatigue (e.g. during CPAP trials) may result in gradual increase in ETCO2 over time (normal Pa-ETCO2) • Sweep speed can be decreased to illustrate gradual trending www.capnography.com Bhavani Shankar Kodali MD
Waveform Trends • Hyperventilation may result in gradual decrease in ETCO2 over time (normal Pa-ETCO2) • This trend may also be caused by a patient with autopeep – incomplete exhalation results in alveolar gas not reaching airway (increased Pa-ETCO2) www.capnography.com Bhavani Shankar Kodali MD
Clinical applications • Estimate PaCo2 • Estimate alveolar deadspace • Optimal PEEP setting • Verify ETT placement • Monitor adequacy of ventilation • Evaluate weaning trial • Monitor effectiveness of CPR • Assess pulm blood flow • Assess effectiveness of bronchodilators • Detect patient/ventilator asynchrony • Immediate alert to accidental extubation, large pulmonary embolism, apnea, circuit disconnection, leaks • Trend metabolic rate
Capnography in ICU Shari McKeown, RRT