Download
1 / 23
240 likes | 364 Vues
IT’s Contribution to Sustainable Value Creation within ING. A joint study by ING Corporate IT and IBM carried out in 2002. ‘Another way to restore trust in corporations is to increase transparency in the way we do business and in how we report on our business’ Ewald Kist CEO of ING Group

E N D
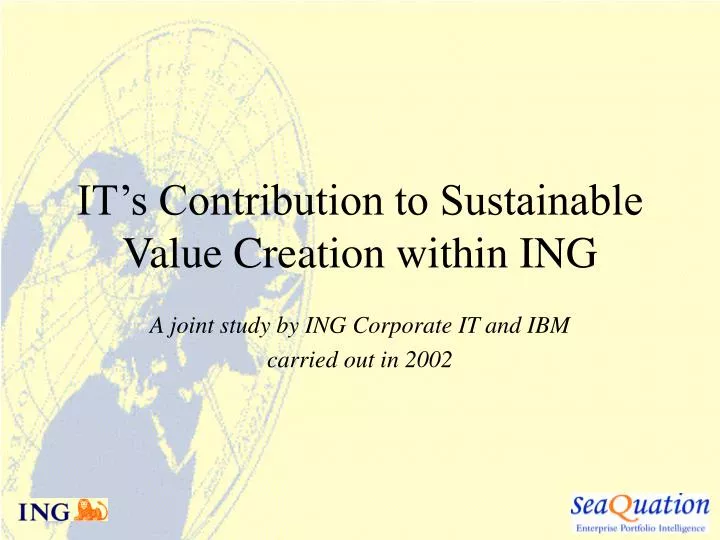
IT’s Contribution to Sustainable Value Creation within ING A joint study by ING Corporate IT and IBM carried out in 2002
‘Another way to restore trust in corporations is to increase transparency in the way we do business and in how we report on our business’ Ewald Kist CEO of ING Group Yale University 14 November 2002
Is IT Delivering Value? ‘IT investment did not improve productivity in 53 out of 59 industry sectors’ McKinsey 2001 ‘High IT spending does not translate into better company results’ Forrester Research 2002 ‘20% of spending on IT is wasted’ Gartner 2002
The Importance of Total Shareholder Return “Our single corporate measure of success is Total Returns to Shareholders (TRS).” ABN AMRO, Annual Report 2001 “The scorecard is our performance, based on total shareholder return in relation to the best in our sector.” Ahold President & CEO Cees van der Hoeven. Press Conference, November 19, 2002 “For stockholders the emphasis must be on achieving attractive shareholder returns.” Aegon Annual Report 2001 “Our commitment to the shareholders who own Prudential is to maximise the value over time of their investment. …Our aim is to deliver top quartile performance among our international Peer Group in terms of Total Shareholder Returns.” Cover of Prudential PLC Annual Report 2001 “Our total return for shareholders has outperformed both our sector and the FTSE 100 over one, five and ten years. This reflects the soundness of our business model.” Headline of Chairman’s Statement Legal & General, Annual Report 2001 Total shareholder return represents the increase in value of the share price plus the re-investment of shareholder dividends
The Importance of Total Shareholder Return “Our single corporate measure of success is Total Returns to Shareholders (TRS).” ABN AMRO, Annual Report 2001 “The scorecard is our performance, based on total shareholder return in relation to the best in our sector.” Ahold President & CEO Cees van der Hoeven. Press Conference, November 19, 2002 “For stockholders the emphasis must be on achieving attractive shareholder returns.” Aegon Annual Report 2001 “Our commitment to the shareholders who own Prudential is to maximise the value over time of their investment. …Our aim is to deliver top quartile performance among our international Peer Group in terms of Total Shareholder Returns.” Cover of Prudential PLC Annual Report 2001 “Our total return for shareholders has outperformed both our sector and the FTSE 100 over one, five and ten years. This reflects the soundness of our business model.” Headline of Chairman’s Statement Legal & General, Annual Report 2001 Total shareholder return represents the increase in value of the share price plus the re-investment of shareholder dividends
The Intelligent Growth Study
IBM’s Intelligent Growth Study analysed the 80 largest insurers worldwide over a five year period. 80 largest insurers worldwide • Insurers with net premiums over $1.5 billion and 40% cumulative share • Total net premiums of $1.5 trillion • Average asset size of $110 billion • Screening approach based on key operating and financial performance metrics • Select set of intelligent growth companies • Winning strategies and tactics for achieving and sustaining intelligent growth 5 years of performance – 1996 to 2000 • Public filings and secondary data • Private equity and analyst reports • Executive interviews
Study of shareholder return in the insurance industry (1996-2000) PREMIUM GROWTH CAGR in Net Premiums Written (NPW) PROFITABILITY Op. Cash Flow as % of NPW CAPITAL EFFICIENCY Op. Cash Flow as % of Assets 4% Above Average (7 insurers, 9%) 30% Above Average (12 insurers, 15%) 3% 19% Below Average (5 insurers, 6%) Above Average (35 insurers, 44%) 15% Below Average (23 insurers, 29%) Total Insurers (80 insurers, 100%) 7% Below Average (45 insurers, 56%)
CAGR IG +29.0% +21.1% DAX +15.7% S&P +10.6% FTSE -7.9% NIKKEI Best in class companies outperform major financial indices Total Shareholder Return 1996 – 2000 300 260 220 180 140 % Total Shareholder Return 100 60 20 1997 1998 1999 2000 2001 -20 -60
ING identified as best in class companyHowever, intelligent growth due largely to M&A rather than operational excellence NIKKEI -7.9% 0% FTSE +10.6% S&P +15.7% DAX +21.1% N/A 22.3% 28.1% 29.5% 30.3% 31.1% 31.3% -10% 0% +10% +20% +30% +40%
Even when adding in the more volatile years of 2001 and 2002 (up to August) the shareholder returns for the intelligent growers continued to outperform these indices.
INTELLIGENT GROWERS EFFICIENTLY OPERATED SLOW GROWERS INTELLIGENT GROWTH POTENTIAL POOR PERFORMERS 16 insurers evenly spread over four categories Combining Metrics from IBM and ING IT Peer Group 40 financial services providers for which ING gathers data on IT investments, IT expenditure and financial key ratios Intelligent Growth Studyanalysis of Total Shareholder Return (TSR) for 80 largest insurers worldwide divided into four categories.
Total Shareholder Return related to better cost management • An additional financial performance metric was identified which was to be used in further analysis – the operating cost to premium ratio. It was clear from the work already done that the higher performers had a significantly lower cost to premium income ratio, the high performers averaging around 12% with the low performers averaging around 25 %. This means that intelligent growth companies were better at managing their Total Operational Costs. Unfavourable Poor performers Cost to Premiums ratio Intelligent growers Average performers Favourable Low High Total Shareholder Return Note: Average performers are slow growers or potential intelligent growers
Intelligent Growers invest differently – partly due to focus on core IT activities. They are also innovative in their use of IT Poor Performers TOC as % of Premium Income IT Cost as % of TOC Slow Growers Potential Intelligent Growers Intelligent Growers New Develop-ment. as % of IT Cost Out-sourcing as % of IT Cost Mainten-ance as % of IT Cost Lower cost structure and a greater degree of IT Outsourcing Higher spending on IT and more emphasis on new development as opposed to maintenance
% New Development Cost related to Revenue CAGRHigh performers tend to have a higher ratio of New Development CostING combines high Revenue CAGR with a lower ratio of New Development Cost High High performers Low performers ING Revenue CAGR R2 = 0.85 Corr. = 0.92 Low % New Development Cost Low High New Development cost as % of IT Cost Note: Only for 8 of the 15 competitors IT metrics could be related directly to individual competitors Total Shareholder value ranking is based on ranking points for Revenue CAGR, Operational Cash / Revenue and Operational Cash / Assets
% Maintenance related to Cost to premiums ratioHigh performers tend to have a lower ratio of IT maintenance cost Low performers Cost to premiums ratio ING R2 = 0.46 Corr. = 0.68 High performers Low High Maintenance cost as % of IT Cost
30 High High performers Low performers 25 20 Total Shareholder Return Ranking 15 10 R2 = 0.54 Corr. = 0.83 5 Low 0 0 5 10 15 20 % Outsourcing cost Low High % Outsourcing related to Shareholder ReturnHigh performers tend to have a higher ratio of outsourcing cost Note: Only for 8 of the 15 competitors IT metrics could be related directly to individual competitors Total Shareholder value ranking is based on ranking points for Revenue CAGR, Operational Cash / Revenue and Operational Cash / Assets
15% IT Intensity (% of Total Operational Cost) 16% 15% % IT New Development Cost 32% 14% % IT Maintenance Cost 8% 25% External labour cost as % of total IT cost 13% 0% 5% 10% 15% 20% 25% 30% 35% High performers peer group: Cost to premiums ratio = 12% ING group: Cost to premiums ratio = 11% ING group compared to best practice ING insurance is a high performer in terms of cost to premiums ratio ING insurance has IT intensity comparable with high performers of peer group
IT Cost drivers related to Shareholder Return High Shareholder return is related to favourable Cost to premiums ratio IT intensity Financial Performance + + %New Development ++ IT Cost Structure Econometrical Analysis % Maintenance - - Total Shareholder Return Cost to Premiums Ratio ++ % Outsourcing - + %Strategic + Legend: +: positive influence -: negative influence 0: No influence IT Investment Mix Portfolio analysis %Transactional + %Infrastructure
Conclusions from Econometric Analysis • Continued cost management focus needed on enhancing cost to premium ratio by replacing labour with capital projects in IT • Shift of expenditure from legacy maintenance to new developments mustbe continuously encouraged • Continue to actively seek favourable outsourcing opportunities (including offshore)
Conclusions and Actions • Continued cost management focus needed on enhancing cost to premium ratio by replacing labour with capital projects in IT • Shift of expenditure from legacy maintenance to new developments mustbe continuously encouraged • Continue to actively seek favourable outsourcing opportunities (including offshore) • Keep active watch on investment portfolio balance. Encourage optimum mix of strategic, transactional, infrastructure, and informational investments • Use outputs from current MTP/IT dashboard process to provide further intelligence and actions • Encourage greater entrepreneurial culture amongst CIOs to strike an appropriate balance between the taking of calculated risks and undue risk aversion in their approach to IT investments. Incorporate such evaluations in CIO performance appraisals and rewards • Bear in mind the Ewald Kist requirement to provide greater transparency to shareholders and other stakeholders on how we govern and manage critical and expensive resources such as IT • Develop article for Shareholder Bulletin and presentation for Executive Board
IT’s Contribution to Sustainable Value Creation within ING A joint study by ING Corporate IT and IBM DISCUSSION 11 December 2002